


Everyone I talk to thinks a golden cross is the most bullish thing that can happen to a Bitcoin chart. It’s days away, so I checked.
A golden cross is when the average price over the last 50 days climbs above the average over the last 200. It’s a lagging indicator. It doesn’t predict a trend, it confirms one that started months ago. And everyone remembers what came after the famous ones. What nobody talks about is the first month, which is often a sell-off.
So instead of going off vibes, I went through all 12 golden crosses in our score history, which runs back to 2012, with the CSH Score alongside each one. Whether Bitcoin was higher or lower a month later turned out to be a coin flip. A year later was a different story, and the score on the day of the cross separated the ones that ran from the ones that didn’t.
The live score, your plan and the new My Plans page are all in the app, free to try right now:
CSH Risk Dashboard
CSH Score: 38.8, up 1.0 over seven days (37.8 last Sunday)
Bitcoin: US$79,986, up 2.9% over seven days (app, 6 Sep)
Band: 30 to 40, where Bitcoin has spent 14.4% of its history
Percentile: bottom 35% since 2012
Days with a CSH Score under 30 this bear: 112. Days under 20: 0
50-week moving average: about US$80,100, price sitting just under it
Day 334 since the October 7 top. Day 365 is October 7
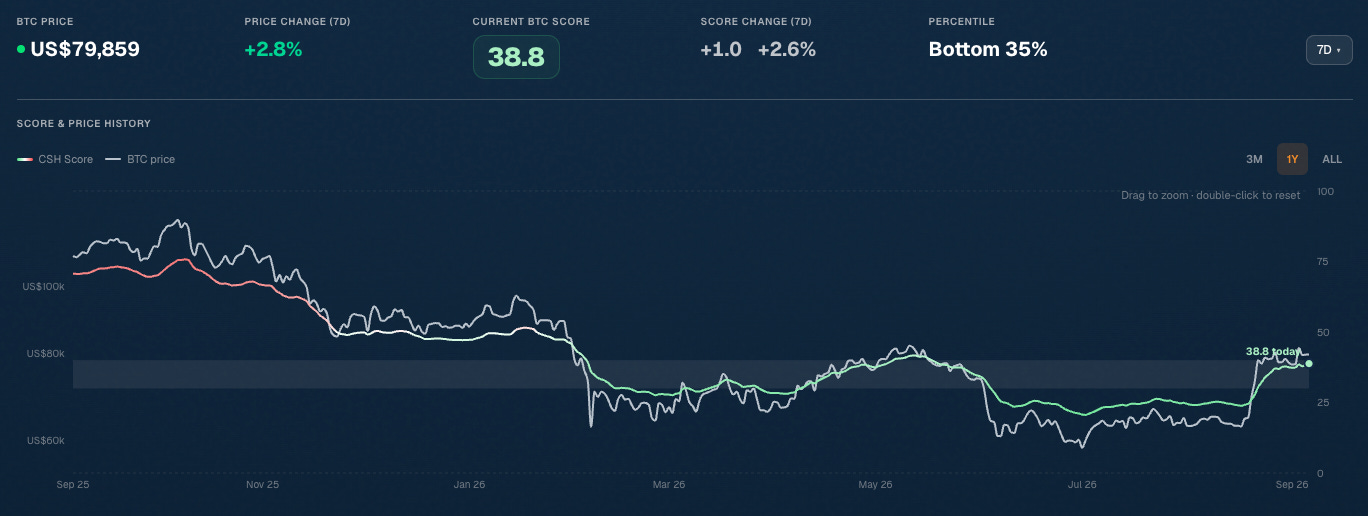
What the reading changes: nothing in my plan. It buys weekly with the CSH Score between 10 and 30 and waits above it, so it’s been waiting since the score crossed 30 on August 22. My bigger buys are parked under 20, and the score bottomed at 20.6 in July without getting there. A CSH Score of 30 maps to about US$70,200 today, which is also the bull market support band on the weekly chart. If a pullback comes, that’s the level I’m watching, because it’s where the plan switches back on.
Twelve golden crosses, scored
Here’s every one in our score history, which starts in 2012, with the CSH Score on the day it fired and where Bitcoin was a year later.
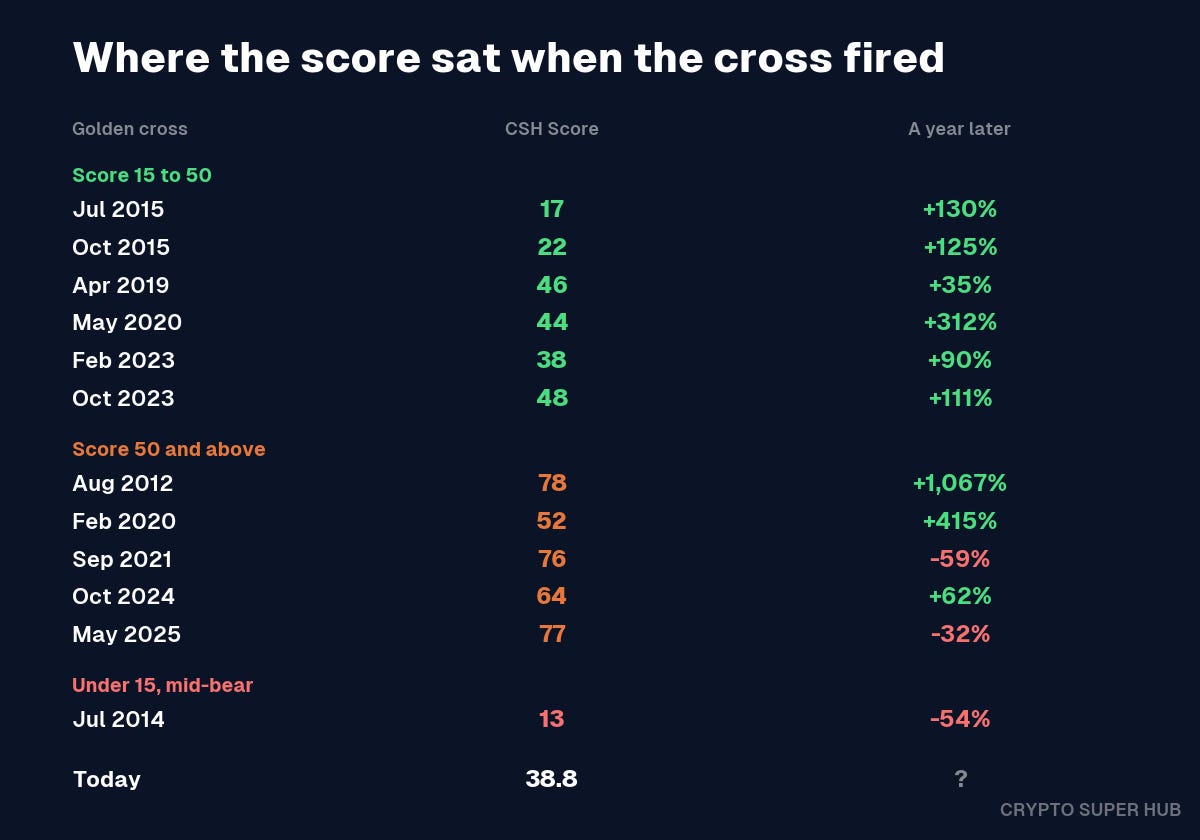
The first month is 50/50. Five of the twelve crosses were lower 30 days later, seven were higher. Five of the twelve also dropped more than 10% at some point in the first 90 days. April 2019 went up 46% in a month. February 2020 fell 39%. Whether Bitcoin goes up or down in the weeks after a golden cross is a coin flip. It has never been a reliable short-term buy signal.
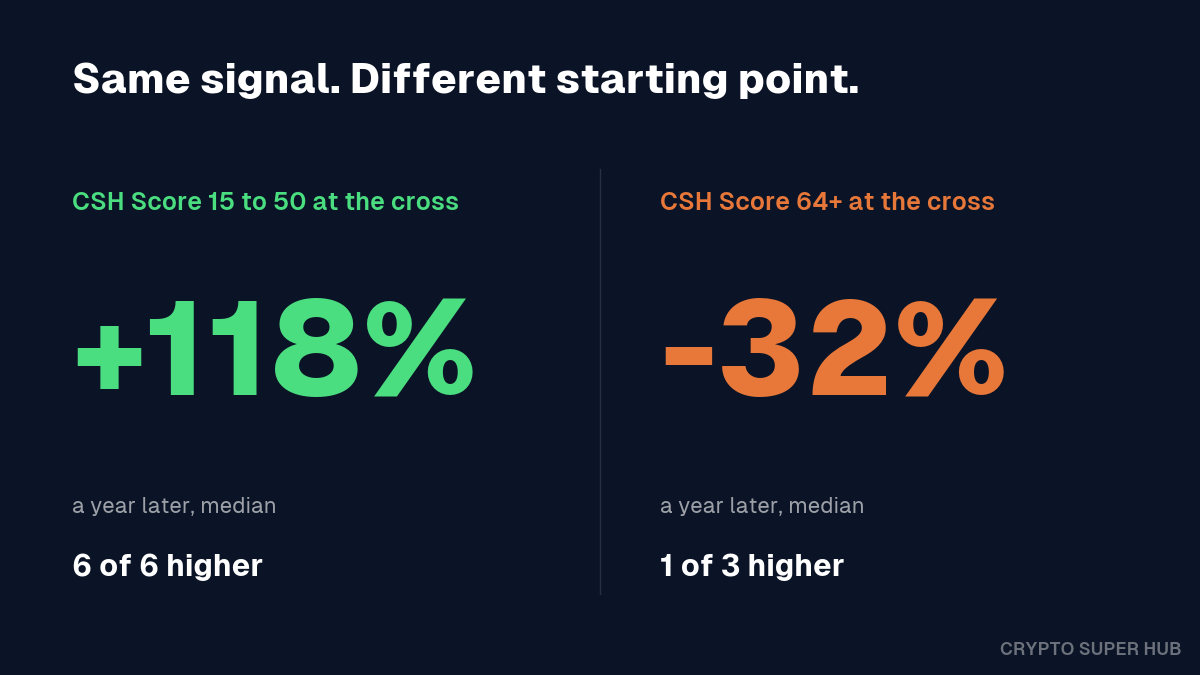
A year later, the score is the tell. The CSH Score is our 0 to 100 read on whether Bitcoin is cheap or expensive against its own history back to 2012. Low means cheap. Six of the twelve crosses fired with the score between 15 and 50, meaning Bitcoin was still historically cheap when the signal came: July 2015, October 2015, April 2019, May 2020, February 2023, October 2023. All six were higher a year later, median gain 118%. Three crosses since 2021 fired with the score at 64 or above, Bitcoin already expensive. Two of those three lost money over the next year: 59% in 2021, 32% in 2025. Same pattern on the chart. The difference was whether the market was starting a move or finishing one.
The first cross after a bear market sometimes fakes. July 2015 and February 2020 were both the first cross after a low. Both reversed inside nine weeks, and both times the second attempt held: 878 days in 2015, 394 days in 2020. In 2019 and 2023 the first one held. Two of the last four recoveries needed a second go, so if this one reverses, that’s not the recovery ending.
The closest match to today is February 2023. CSH Score 37.6 at the cross, 38.8 now. Bitcoin dropped 12.5% over the following month and the score fell back to 32. A year later it was up 90%. I’m not saying this year copies that one. I’m saying the one time the signal fired with the score where it is now, Bitcoin fell for the first month and finished the year up 90%. Short-term bearish, long-term very bullish.
Jake’s Workbench
Tom shipped the new My Plans page from Europe this week, and it’s changed how I start the day.
The top of the page is one card. Mine this morning says: CSH Score 38.8, outside your range of 10 to 30, your plan says wait. The US$2,161 it would have bought this week stays in cash. Then an email lands each morning saying the same thing. Two questions answered before coffee: is the score inside my range, and if not, how far outside.
Below that is the plan’s own record. Three orders since June 24, all inside the range, average price US$63,215, with the CSH Score in the low 20s on every one of them. And below that, once your history is imported, every trade you’ve ever made plotted against the score on the day you made it, plus a bar chart of which score bands your money actually went in at.
That last chart is the honest one. Mine says 30.5% of my Bitcoin dollars went in at a score of 20 to 30, 30.5% at 30 to 40, and 39% at 60 to 80. That last 39% was all before we built the system. The plan exists so it never happens again.
An SMSF trustee DMed two feature requests this week: a confirmed-uptrend signal, and a long-term versus short-term read on a buy. Both are on the board. The founding cohort is 100 people, that number is real, and this is what your feedback does to the product.
Quick Hits
US CPI lands Friday night our time (Friday 11 Sep, 8:30am ET). PPI the day before.
The CLARITY Act gets its Senate procedural vote on Tuesday 15 September, 2:15pm ET. It needs 60 votes to proceed.
The Fed decides on Wednesday 16 September US time, 4am Thursday here. The quiet period started yesterday.
The concessional contributions cap went up to $32,500 on 1 July. If you salary sacrifice into a fund holding crypto, that’s the new ceiling.
Scam and hack volume across the desk is rising every week. Unique passwords, a dedicated email for exchange accounts, 2FA on everything, and paste anything suspicious into Claude or ChatGPT before you act on it. A screenshot and the question “is this legit” is the cheapest security audit you’ll ever run.
Week Ahead
The golden cross will probably print between Tuesday and Wednesday, and every feed you follow will notice. The number I’m watching instead is the weekly close, Monday morning our time: a close over about US$80,100 is the first weekly finish above the 50-week average in this recovery, the signal that ended the last three bears. Below it, and I’m still watching US$70,200, the level where the CSH Score reads 30 and my plan starts buying again.
Then next week gets loud: the Senate vote Tuesday, the Fed early Thursday our time, quad witching Friday. Now is the week to be set up, not the week after.
The Close
Strong opinions, held loosely. I’ve got a strong one: I want a pullback into my range, and I think the FOMO I’m hearing on the phone every day says the market needs one. If Bitcoin closes a week above the 50-week average instead, I’m wrong, and I’ll change my mind that day rather than wait for the market to prove me right. There are no awards for being right in the markets. The only award is making money, and the way you keep it is a plan written down before the noise starts.
Write yours down this week. The score’s public, the plan builder’s free to try, and the market’s about to get busy.
Jake
Crypto Super Hub is general information and education only. Nothing here is financial advice, and it doesn’t take your objectives, financial situation or needs into account. Crypto is volatile and you can lose money. Past performance doesn’t guarantee future results. Do your own research and consider speaking with a licensed financial adviser before making investment decisions. We hold Bitcoin ourselves, so assume we’re biased.