

Crypto Super Hub — The Weekly Brief | 19 July 2026
The loudest week of doing nothing
My feed spent the whole week calling the bottom. Confident threads, victory laps, “you had your chance” posts.
Meanwhile I did nothing. Not a single discretionary move. My weekly buy fired on schedule, the way it has every week this year, and the bigger orders in my plan stayed exactly where they’ve been for months: loaded, waiting, untriggered.
Two weeks of Bitcoin grinding sideways in the low $60Ks will do strange things to people. Some snap and sell. Some declare the bottom, because being early feels like being smart. In 2021 I was the second kind. The grind cost me more than any crash did, because boredom is when you start improvising.
So this week I went looking for an actual answer. Not vibes, not someone else’s chart. I pulled our full score history, every day since February 2012, and asked one question: what did every previous bear market do before it ended, and has this one done it?
The answer is the cleanest thing I’ve seen all year.
The CSH Risk Dashboard
CSH Score: 24.9 / 100, up 0.8 on the week (+3.3%), sitting in the 20 to 30 band. Bitcoin has only spent 15.1% of its history down here. Today’s reading is in the bottom 21% of every score we’ve ever printed.
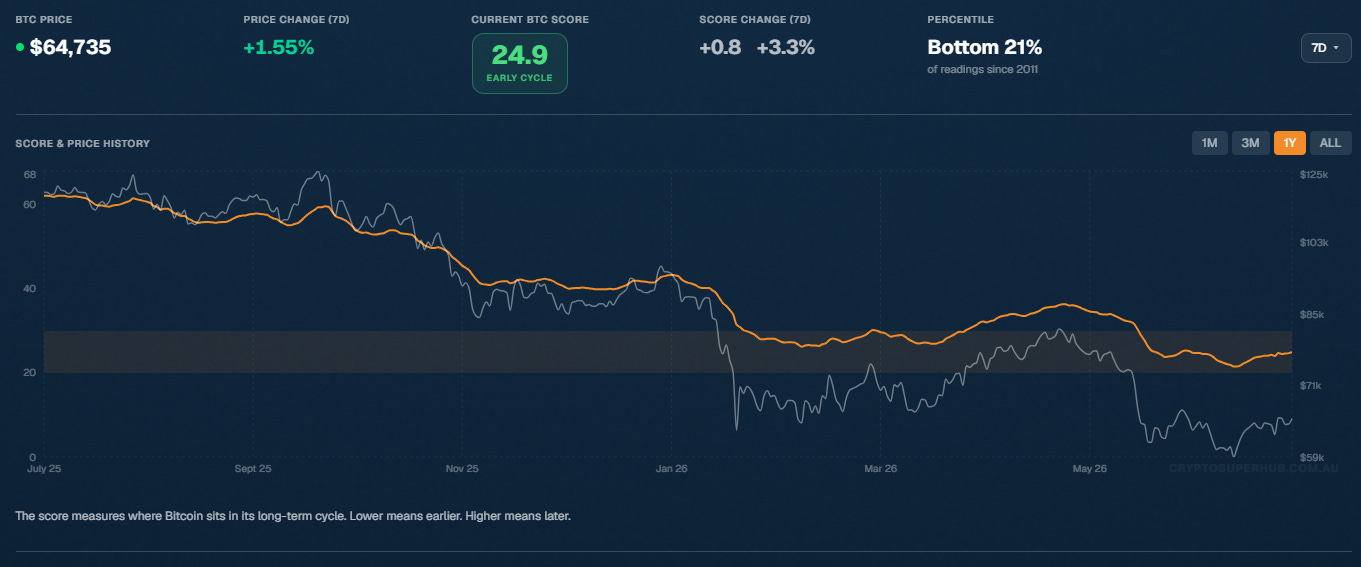
The numbers that matter this week:
BTC price: $64,739 (7d: +1.55%)
Cycle low so far: score 21.5 on July 1, at $58,551
The 200-week moving average sits near $63K. Price is trading right on top of it.
Days this year with the score under 30: 107 of the first 199
Days this cycle with the score under 20: zero
Jake’s read: the score says accumulation territory, but price is stuck in a shrinking wedge. Long-term support underneath, the old bull market support band pressing down from above. Squeezes like this end with a break, one way or the other. My plan doesn’t need to guess which way. Standard buys keep running at these levels, and the aggressive tiers stay parked until the score does something it hasn’t done all cycle. More on that in a second.
The checklist this bear hasn’t run
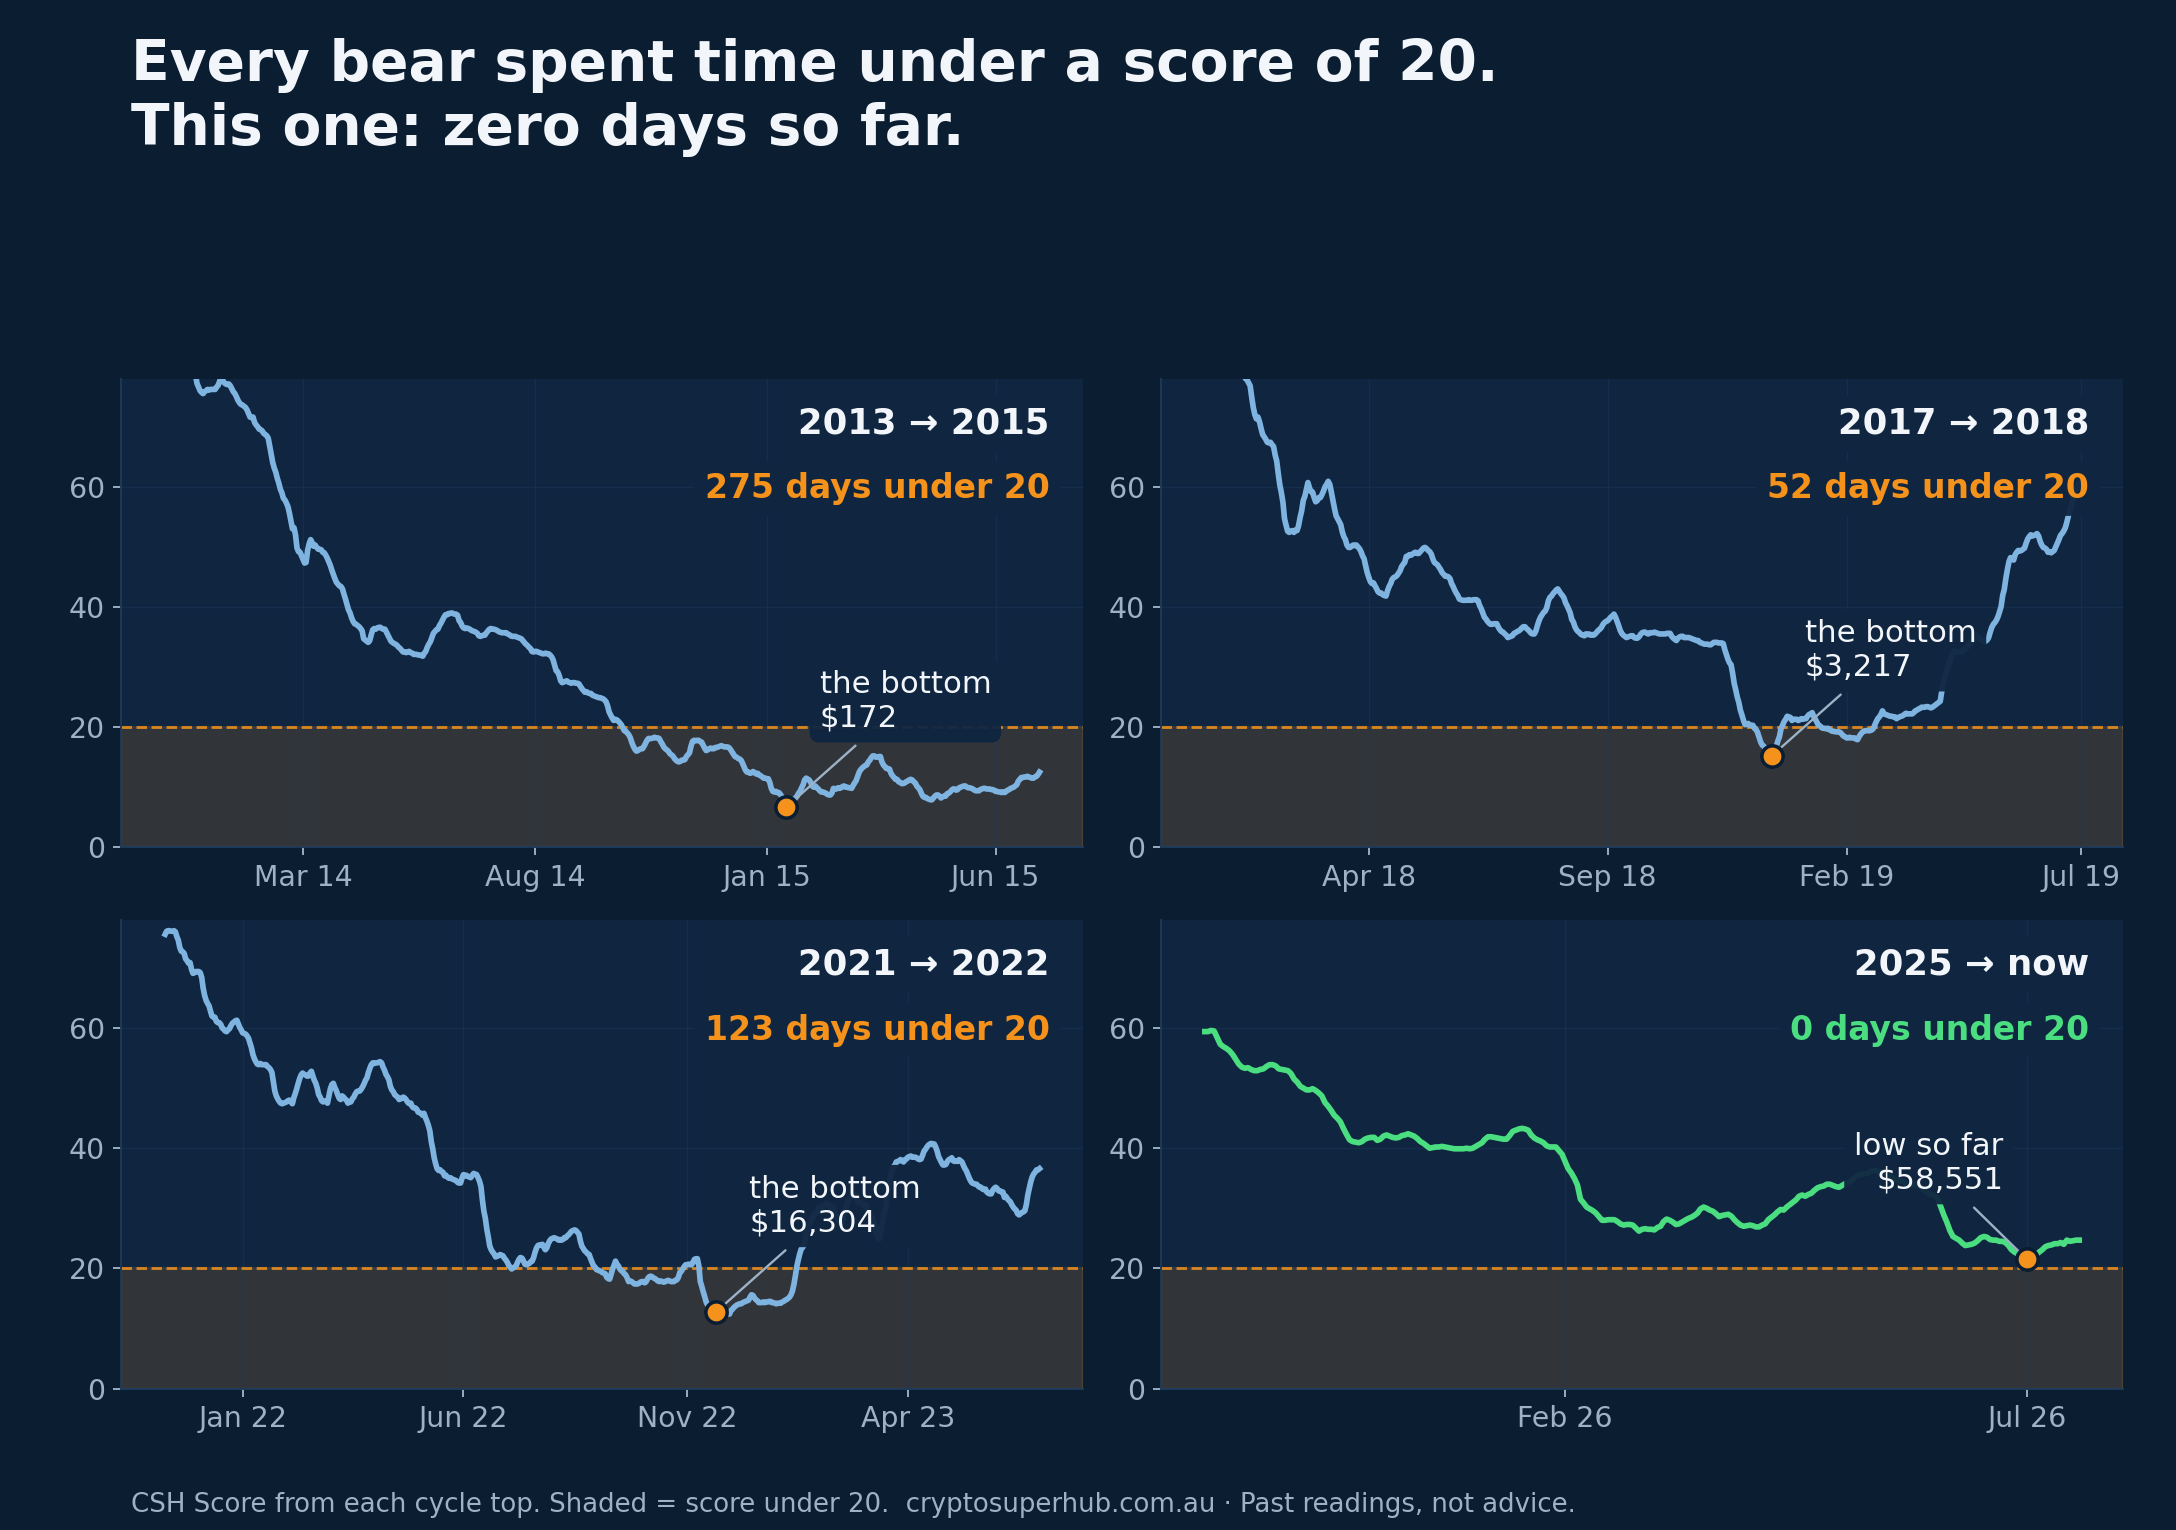
Since 2014, every Bitcoin bear market has done three specific things before it ended. Not sometimes. Every time.
1. It took its time. The modern bears all ran roughly twelve months from top to bottom. This one topped in October 2025. Twelve months puts the window in the fourth quarter of this year. We’re in month nine.
2. It pushed the score under 20. This is the one that stopped me. The 2014-15 bear spent 275 days with the score under 20. The 2018 bear spent 52 days there. The 2022 bear, 123 days. This cycle so far: not a single day. The closest we’ve come is 21.5, on July 1.
3. It got cheaper than the average buyer’s cost. There’s an on-chain number called the realised price: the average price at which every Bitcoin last changed hands. Think of it as the market’s collective break-even, currently around $53K. In every previous bear, price fell through that level before the bottom was in. June’s low of $57K got close. It never touched it.
Three checkpoints. Zero completed. That’s why I’m not in the bottom-is-in camp, however much I’d like to be.
Now the honest other side, because there is one. This drawdown has been shallower than past bears at the same stage. The ETFs are a class of buyer that simply didn’t exist in 2018 or 2022, and they may put a higher floor under this cycle than history suggests. And at the June low, more Bitcoin was underwater than in profit for the first time this cycle, a condition that has historically shown up in the same neighbourhood as bottoms. A reasonable person could weigh all that and conclude the low is closer than my checklist implies.
Here’s the part that actually matters for your money: I don’t need to win that argument, and neither do you. If the bottom is in, my weekly buys at scores in the low 20s will look very good. If it isn’t, my bigger orders are waiting below 20 with cash ready. The plan covers both branches. A prediction only covers one.
Jake’s Workbench
I put Claude to work on our score history this week. 5,279 days of data, one question: if you’d bought Bitcoin on any given day, what was that purchase worth 12 months later, grouped by what the score read on the day you bought?
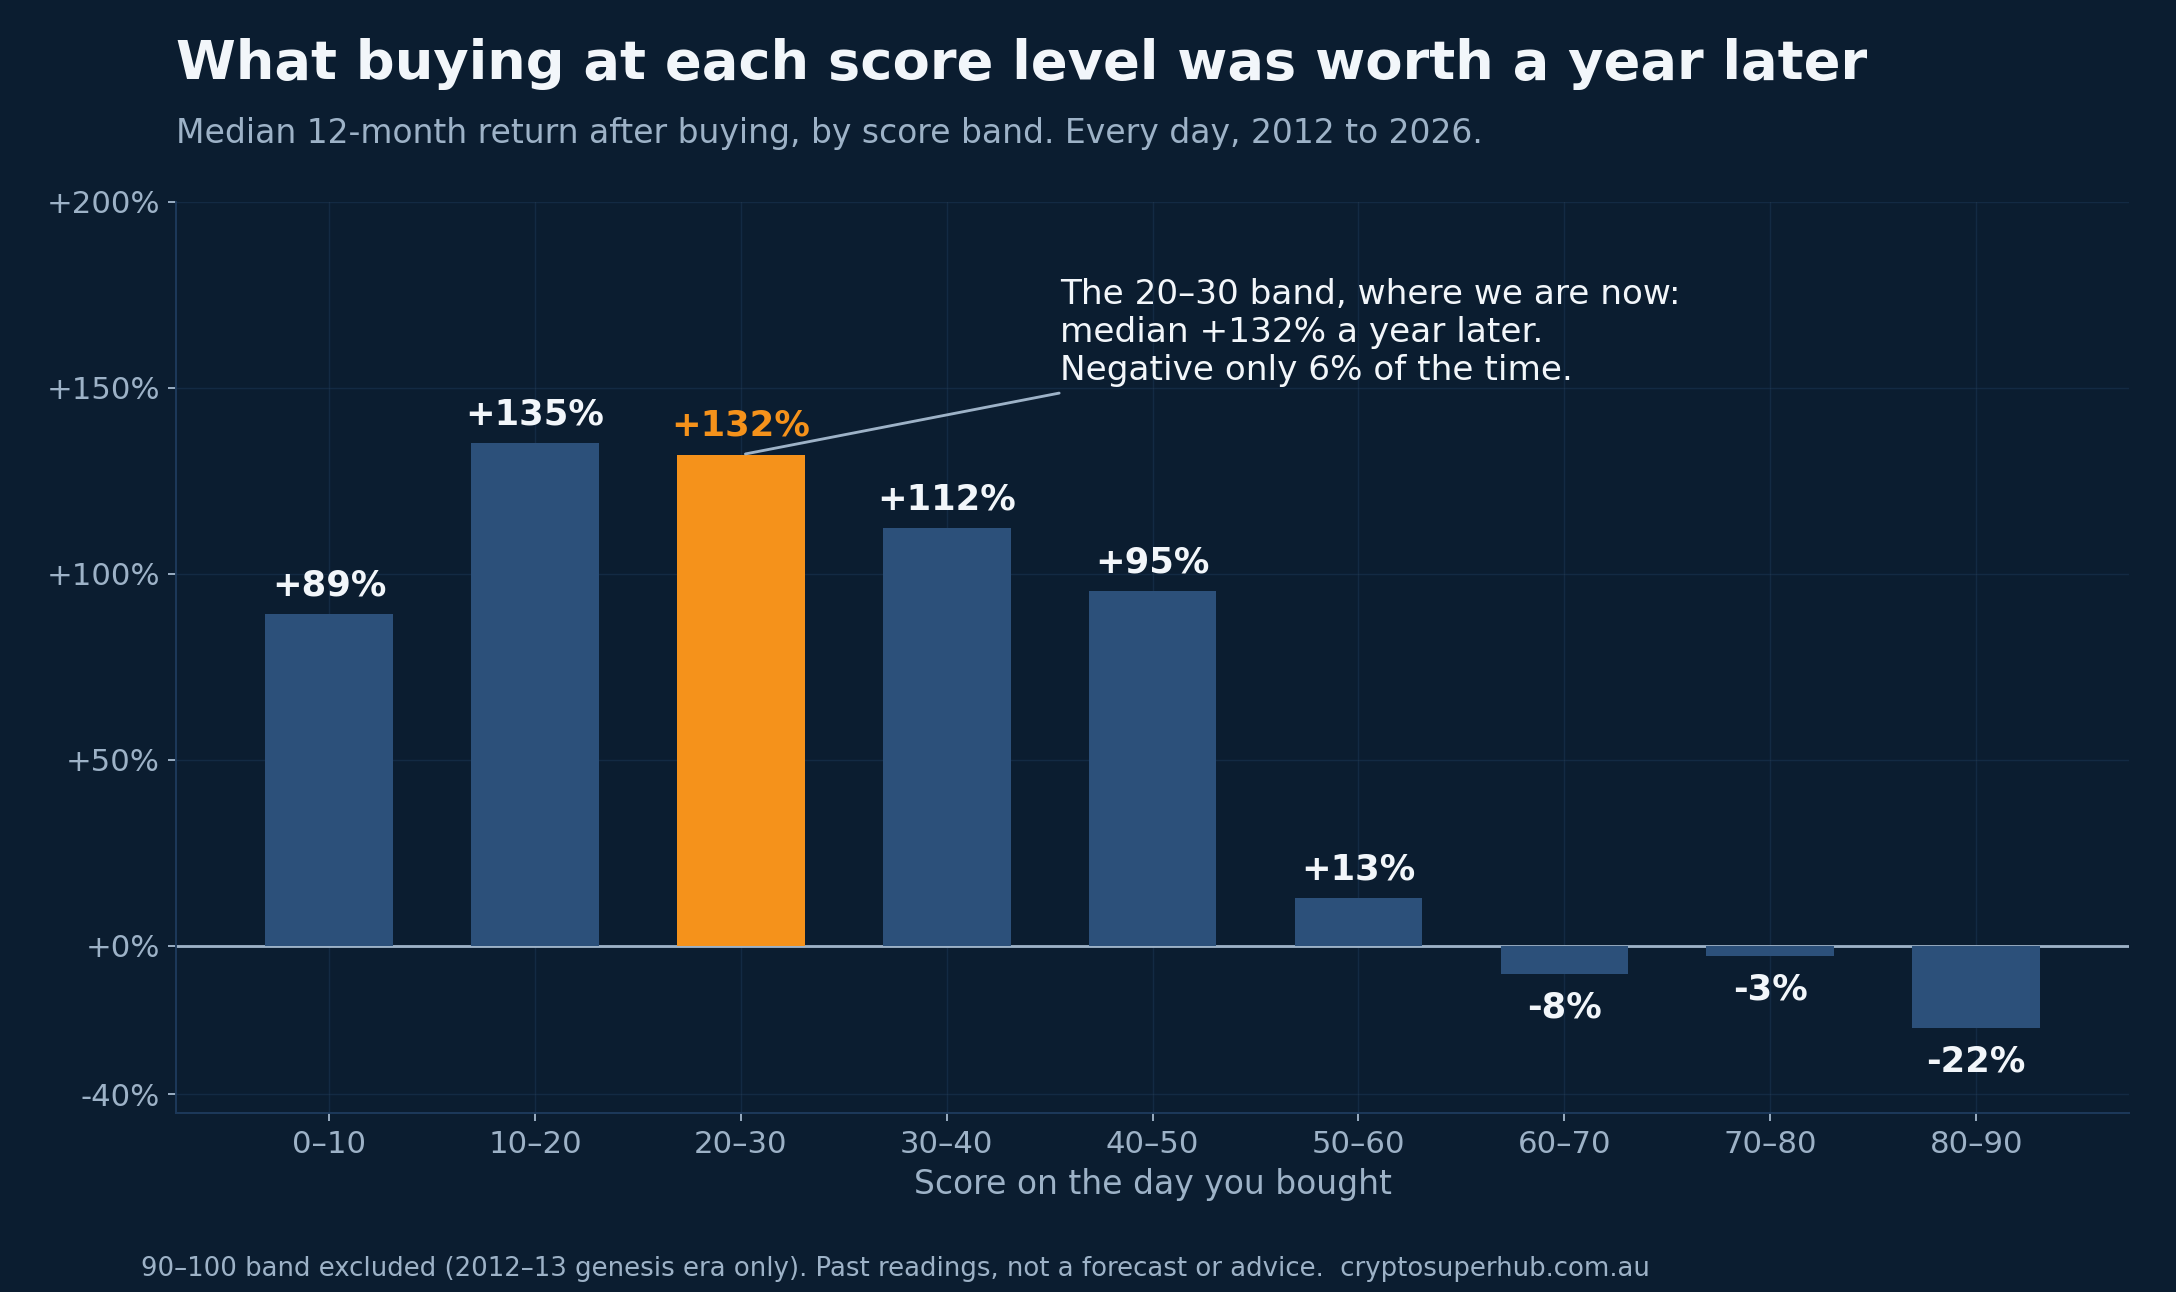
The results, in plain English. Bought anywhere in the 20 to 30 band, where we are today, the median outcome a year later was +132%, and only 6% of those days ended the year negative. Bought above a score of 60, the median outcome was a loss.
Read that again slowly, because it’s the whole philosophy in one chart. The edge doesn’t come from catching the exact low. Buyers in the “pretty cheap” band did about as well as buyers in the “screaming cheap” band. The edge comes from refusing to buy euphoria and being systematically present near the floor. Fifteen years of data, one sentence.
Past readings, not a promise. But it’s exactly why the plan exists.
Also on the bench this week: we’re tuning the score engine for ETH, SOL and XRP (close, but numbers don’t ship until the forward-sims stop surprising us), and we’re debating exchange API sync versus CSV upload for portfolio tracking. If you have a view on that one, reply to this email. I read everything.
And if you haven’t built your plan yet, this stretch of the cycle is exactly what the Plan Builder is for. Build it while the market is boring. Execute it when it isn’t.
Quick hits
One Bitcoin now buys about 16 ounces of gold. At the October top it bought roughly double that, and the June dip touched 14. Gold is only ~19% off its January record while BTC ground lower, which makes this Bitcoin’s cheapest stretch against gold since 2023. Two “fear assets,” two very different years.
The Fed held at 3.50 to 3.75% and dropped its easing bias. June inflation came in cooler than expected, yet markets now price September as a coin flip and lean toward a hike by December. Tight money into a bear market’s final quarter is a headwind worth respecting.
Spot ETF holdings have rolled over, slipping back below 1.25M BTC after peaking in late 2025. The buyer that absorbed everyone’s selling on the way up has gone quiet. Whether it comes back before Q4 is one of the bigger questions in this market.
August and September have been red in every midterm election year on record (2014, 2018, 2022), with August the worst of the pair. Seasonality isn’t destiny. But if the next two months get ugly, nobody here will be surprised.
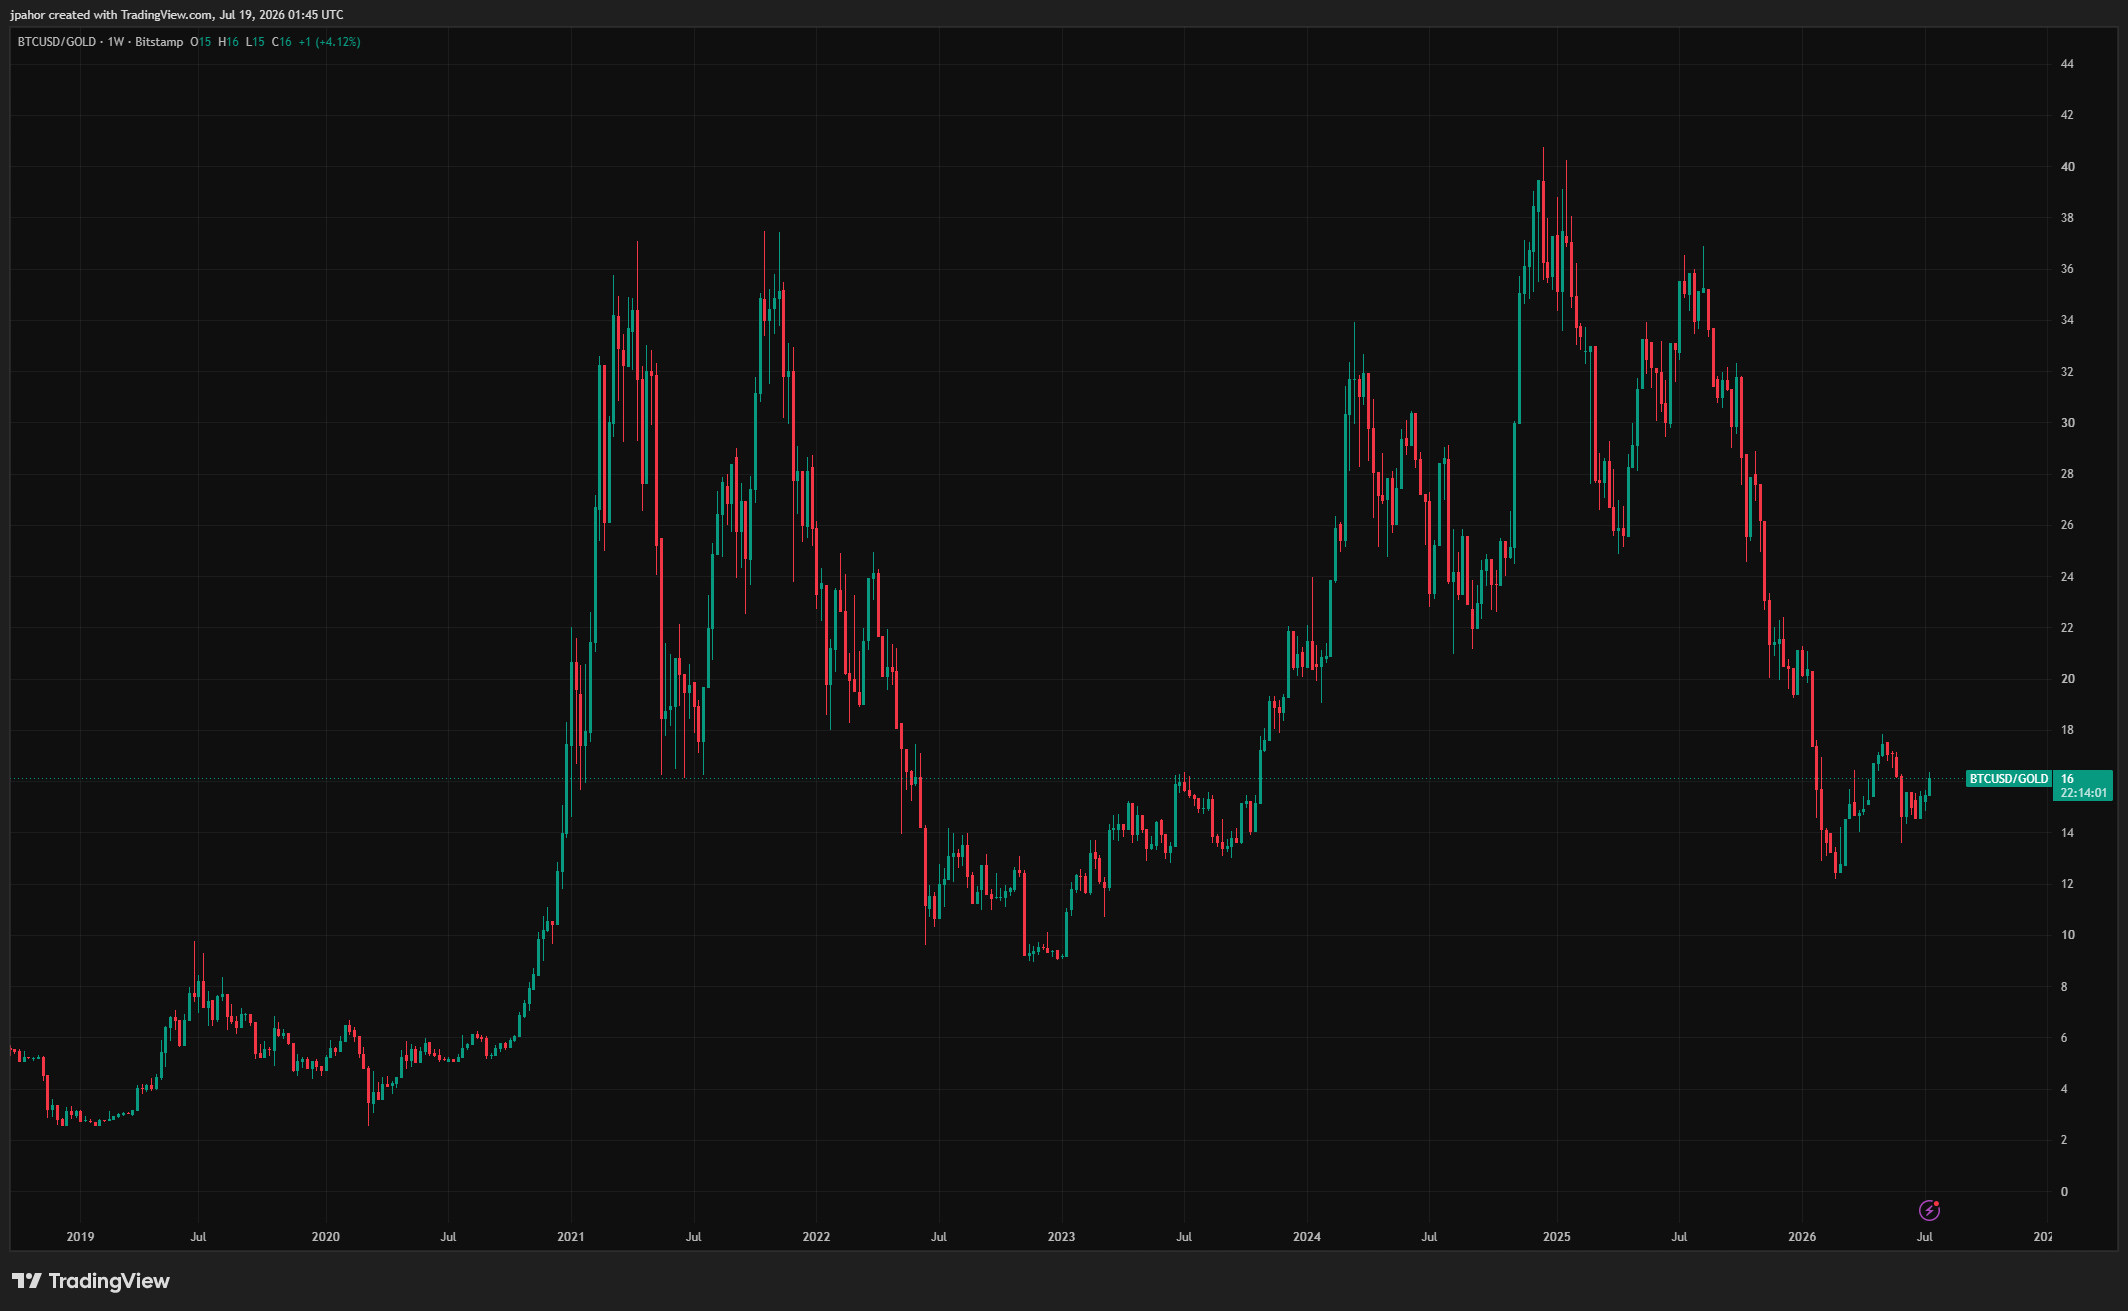
One Bitcoin bought 31 ounces of gold in October. Today it buys 16.
The week ahead
The 200-week moving average, ~$63K. Price is sitting on it now. Weekly closes above it keep the recovery scenario alive. Losing it again would rhyme with 2022, where the second break was the one that mattered.
Score 20. The line this entire issue is about. If it prints, you’ll hear from me, and my plan gets busy.
~$53K. The market’s collective break-even. If price goes looking for it, that’s the zone where every previous bear found its floor.
The close
Every bear before this one ran the same checklist, and this one has barely started it. That’s not a reason for fear. It’s a reason for a plan.
The founding cohort for CSH’s paid launch is capped at 100 people, and that number is real, not marketing. If you want to be in it, the waitlist is here.
See you next Sunday. Boring buys until then.
— Jake