

Crypto Super Hub — Weekly Market Intelligence | April 5, 2026
Forty-six consecutive days of extreme fear. That’s where we are right now. The Fear & Greed Index hit an all-time low of 5 back in February and hasn’t left the basement since. BTC just slid from $74K back to $67K. Oil is above $109 after the biggest monthly surge since the 1980s. And every second post on Crypto Twitter is either calling for $50K or pretending everything’s fine.
Neither camp has a system. That’s the difference.
This week I want to zoom all the way out. Not to ignore the short-term risk (I’ll get to the bear flag in the Dashboard) but because I think the most important conversation in crypto right now isn’t about the next dump. It’s about what this price, at this score, actually means for the people building a position over the next decade.
CSH Risk Dashboard
CSH Score: 21.9 (up 0.5 from last week) Market Sentiment: 11, Extreme Fear BTC Price: $67,080 (+1.89% over 7 days)
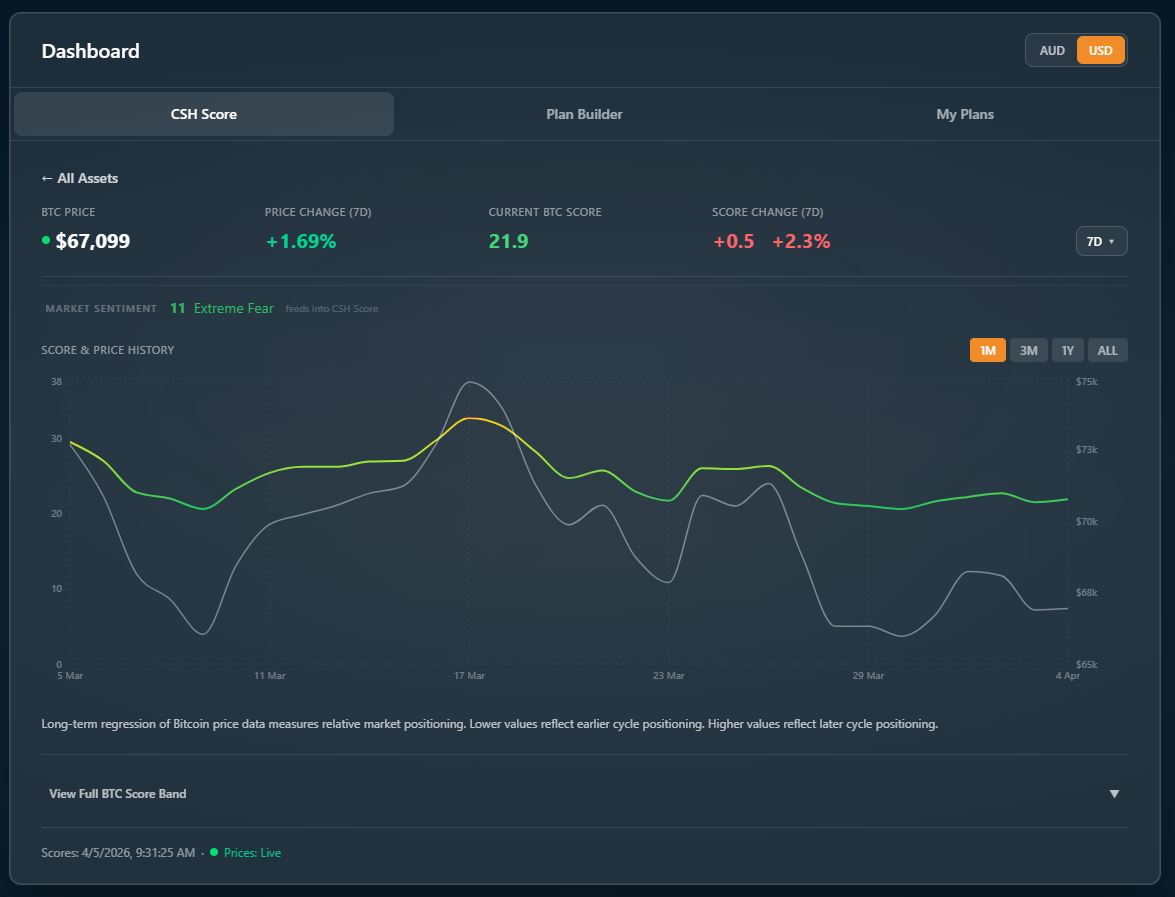
Last week the score was at 21 and I flagged $65-67K as the critical support range. The line to watch was $65,500. BTC dipped to the bottom of that range and held. Price is up slightly to $67,080 and the score has ticked up to 21.9. Not a reversal. But the floor hasn’t broken.
Sentiment has crept from 9 to 11. Still Extreme Fear. Still the lowest sustained readings since this bear market began. The score has been below 30 almost continuously since early February. One brief wick above on March 17th. That’s it.
Here’s the broader picture. BTC is sitting 47% below its October 2025 all-time high of $126,198. March snapped a five-month losing streak (Oct -4.2%, Nov -7.1%, Dec -2.8%, Jan -10.1%, Feb -14.9%) but barely. A 1.8% green candle after five months of red.
The score at 21.9 tells me we’re positioned closer to cycle lows than cycle highs. That doesn’t mean we can’t go lower. It means the risk/reward profile looks completely different at 21.9 than it did at 75 or 80 back in late 2025.
Two things I’m watching on the technical side. First, the structure from November through January: sideways to slightly up, then a sharp dump into February that took us to $60K. We’ve been doing the same thing from February to now. Sideways to slightly up, grinding between $63K and $75K for over two months. If the pattern rhymes, seasonality would suggest another leg down into April or May. Second, the 3-day chart is forming what looks like a bear flag, a consolidation pattern that typically resolves lower.
I’m not predicting. I’m reading the score, watching the structure, and adjusting my DCA accordingly. That’s the system working.
The One Thing That Matters: The Generational Wealth Case for Bitcoin
Everyone in crypto has a price target. Not many have a thesis.
Here’s mine, and it’s the same one I laid out in my recent article: Bitcoin isn’t a trade. It’s a 10-to-20-year wealth-building vehicle, and the people who treat it that way will outperform the ones timing every candle.
Last week I walked through the maths on flat DCA vs the CSH system. That was the micro view: how adjusting your entries to the score puts you 42% ahead over 51 months. This week I want to pull even further back.
The numbers back the zoom-out. Bitcoin has returned over 15,000% in the last decade. Not smoothly. There were 50%, 70%, even 85% drawdowns along the way. But if you held through those drawdowns, or better yet, DCA’d into them, the result speaks for itself. Every four-year cycle in Bitcoin’s history has produced a higher low and a higher high than the one before it.
Right now we’re 47% below the all-time high. The realised price (the average cost of every Bitcoin on the network) sits around $54,000. We’re only 21% above that level. Historically, when BTC trades this close to its realised price, it’s been closer to a cycle bottom than a cycle top. Not guaranteed. But the data leans that way.
So why isn’t anyone talking about this?
Because fear is louder than math. The Iran conflict is dominating headlines. Brent crude has surged from around $67 to over $109 a barrel since the war started in late February, a gain of more than 60%. The S&P 500 is down 4.6% for the year, with March alone dropping 5.1%. Rate hike odds have started appearing for the first time in years. In that environment, nobody wants to hear “zoom out.” They want to hear “what’s happening in the next hour.”
But that’s exactly when the zoom-out matters most. The people building real wealth in Bitcoin aren’t the ones reacting to every geopolitical headline. They’re the ones with a plan: a risk framework, a DCA schedule, exit targets set before they buy. They execute regardless of what the Fear & Greed Index says.
A CSH Score of 21.9 doesn’t mean “buy everything now.” It means the conditions for building a position are here. The system is telling you to pay attention, not to panic.
Jake’s Workbench
Tom and I have been building together for over a year now. He handles all the technical development, I handle content and strategy. And we both still work full-time at Coinstash while doing this.
I mention it because I think people underestimate what’s possible when you build with focus instead of funding. Tom coded the entire CSH platform (the Score, the Plan Builder, My Plans) largely through vibe coding and AI-assisted development. No massive dev team. No venture capital. Just two blokes with a shared conviction that crypto investors deserve better tools than what’s out there.
Last week I mentioned Tom is deep in the data building the scoring framework for ETH, SOL, and XRP. That work is continuing. Each asset behaves differently through cycles and the model needs individual calibration. We’ll share progress as it comes together.
The bigger point: the best time to build is when everyone else is scared. Bear markets clear the noise. They show you who’s building for real and who was just riding the wave.
We’re building.
Quick Hits
ETF money is back. After four straight months of outflows totalling $6.4 billion between November and February, spot Bitcoin ETFs pulled in $1.32 billion in net inflows in March. BlackRock added roughly $98 million on the last day of the month alone. Institutions were buying while sentiment was at its lowest. So what: Smart money doesn’t wait for green candles. The system doesn’t either. At a score of 21.9, the same logic applies to your DCA.
Retail buys, whales sell. On-chain data shows small wallets have been buying every dip for two months straight, expecting a quick return to six figures. Meanwhile, the Exchange Whale Ratio surged from 0.34 in January to 0.79 by late March. Large holders are distributing into retail demand. So what: This is why “just DCA bro” without a risk framework doesn’t cut it. The system sizes your entries to the cycle so you’re not the exit liquidity.
Stablecoins hit $317 billion. Total stablecoin market cap crossed a new high this week, with $1.36 billion in fresh weekly inflows. Stablecoins made up 75% of all crypto trading volume in Q1 2026, and total transaction volume exceeded $28 trillion, more than Visa and Mastercard. So what: The infrastructure is growing even when prices aren’t. That’s a long-term signal, not a short-term one.
The Week Ahead
Trump’s April 6 deadline for Iran to reopen the Strait of Hormuz lands today. That could be a turning point or another escalation. Either way, oil above $109 keeps inflation pressure alive and weighs on everything.
The CLARITY Act markup is expected in the Senate Banking Committee after Easter recess ends on April 13. If it passes committee, it would be the first real federal framework for digital assets in the US. Institutional money has been waiting for exactly this kind of signal.
The FOMC meets April 28-29. This could be Jerome Powell’s final meeting as Fed Chair before Kevin Warsh takes over on May 15. With oil where it is, watch for any hawkish language. April CPI (mid-month) will be the first print capturing the oil shock. If it comes in hot, rate cuts are dead for 2026.
The bear flag structure I mentioned in the Dashboard (that multi-week consolidation between $63K and $75K) should resolve one way or the other this month. A break below $67K opens the door to $60K-$61.5K. A push above $75.9K (the March high) kills the bear flag thesis.
Forty-seven percent below the all-time high. A score of 21.9. Extreme fear for 46 straight days. And somewhere in all that noise, a generational asset is quietly getting cheaper.
The question isn’t whether Bitcoin will recover. Every cycle in its history says it will. The question is whether you’ll have a plan when it does.
— Jake
Reply with your BTC bottom call for this cycle. Just a number. I’ll feature the best ones next week.
$55k spike to the bottom