

Crypto Super Hub — Weekly Market Intelligence | May 4, 2026
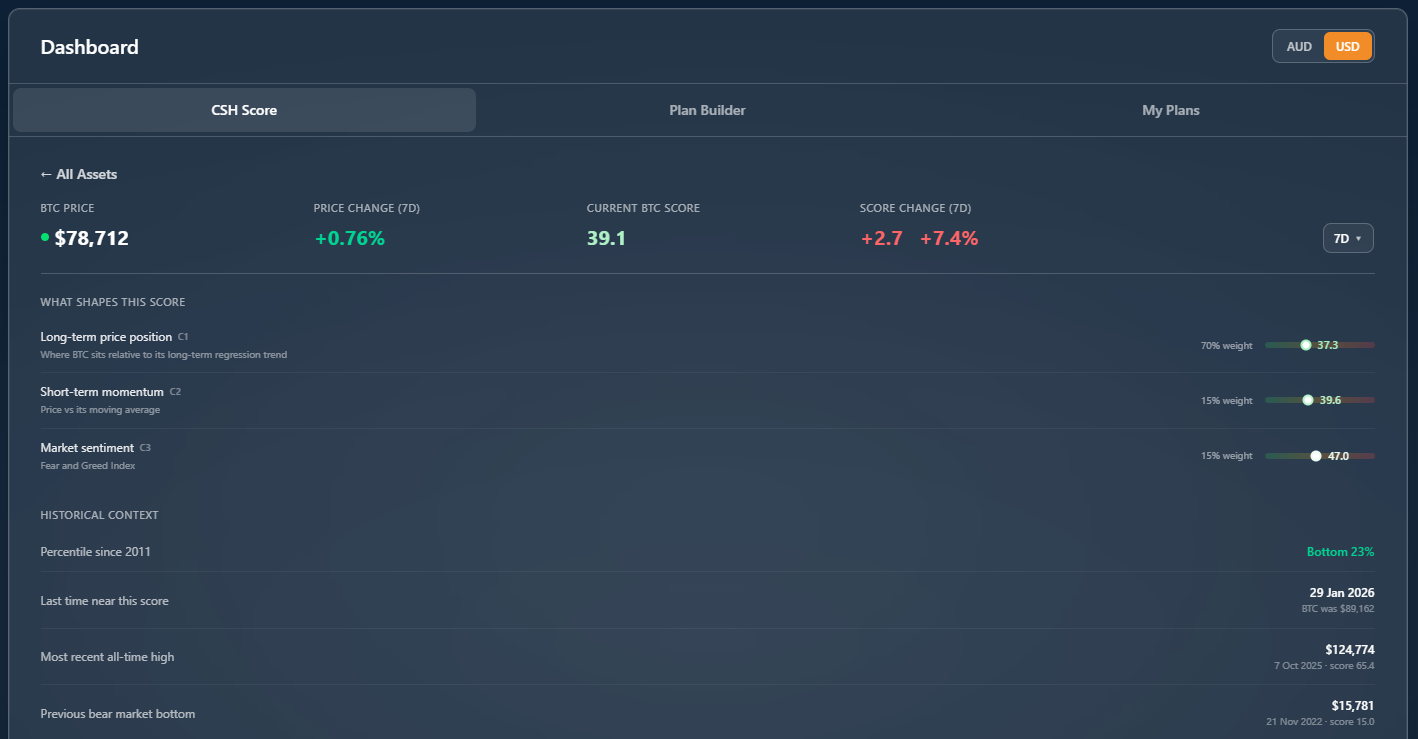
This week’s Score reading: 39.1. The bottom 23% of all Bitcoin readings since 2011.
When the Score sits in the 35-50 band, our Adaptive rule has beaten Static DCA in 91% of the 22 historical entry windows we tested. That’s the cleanest signal I have for what to do right now.
Quick context if you’re new: Adaptive is the rule we just shipped in the new Plan Builder. It scales your buy size with the Score. Bigger orders when the Score is low (the cycle’s cheap). Smaller orders when the Score is high.
Now to what’s awkward about it.
Across 15 years of Bitcoin data and 112 rolling 4-year windows, the Adaptive rule’s median outcome was $607K. HODL’s median outcome was $999K. By the simplest measure, the rule loses to just stacking and never touching it. Everyone who tells you their system “beats HODL” is selling you the upside without admitting the average.
I shipped it anyway. I’m running it for my SMSF. The X article published this week walks through every backtest window.
There’s one calculation that reconciles the 91% with the loss on the median. It has nothing to do with what HODL averaged.
CSH Risk Dashboard
The Score added 2.7 points on the week to that 39.1 reading. BTC ticked up 0.86% to $79,051, basically flat.
That’s a 7.4% lift in the Score on a sub-1% price move. Price barely budged. Cycle position kept improving in our favour.
Where this Score sits historically: bottom 23% of all readings since 2011. Fifteen years of daily data, and we’re still in the cheapest quarter Bitcoin has ever traded in.
Component breakdown: Long-term price position 37.3 (the 70% weight). Short-term momentum 39.6. Sentiment 47.0. The first two are still saying “we’re in early-cycle accumulation territory.” Sentiment is the only one creeping back toward neutral, which makes sense after Bitcoin closed April up 11.87%.
Last time the Score sat near 39: January 29, 2026. BTC was $89,162 then. Today BTC is over $10,000 cheaper at the same Score reading. That’s the kind of dislocation between price and risk the system is built to surface.
Plan Builder action this week: still in the 30-50 band. Adaptive rule fires at 2x base. Same rule, same action, no decisions to second-guess.
See the live Score and start building your own rule.
Median Is the Wrong Measure
Most investors optimise for the median outcome. Read any HODL-vs-DCA debate online and the argument always lands the same way: “this strategy outperformed in the average case.”
That framing assumes the average case is the case you’ll experience. It isn’t. You only get one path through the cycle.
The question that matters isn’t “what happened on average across 112 backtest windows.” It’s “what happens if I get the bad version?”
Here’s where the rule earns its keep.
HODL median across the backtest: $999K. Adaptive rule median: $607K. HODL wins by $392K on the typical outcome.
But:
HODL floor (worst case across 15 years of data): $140K. Adaptive rule floor: $320K. The rule wins by $180K when conditions go against you.
The Adaptive rule’s floor is 2.3 times higher than HODL’s. That’s the bargain. You give up upside in the typical scenario in exchange for a much better floor when the world doesn’t cooperate.
This matters more if your money has a deadline. SMSF money has a deadline. The cycle doesn’t care about your timeline. If your retirement window lands at the wrong point, the typical case isn’t comforting. The floor is what determines whether the plan still works.
It gets more interesting when you start a rule from where the Score sits today.
In the 35-50 entry band, the Adaptive rule beat Static DCA in 91% of 22 historical entry windows. From this exact starting condition, you’re not trading upside for floor. You’re winning on both.
A specific case: someone deploying $100K starting February 2022, when the Score sat where it sits now. HODL produced $217K over four years. Static DCA produced $325K. The Adaptive rule produced $414K.
Same starting capital. Same 4-year window. Different system.
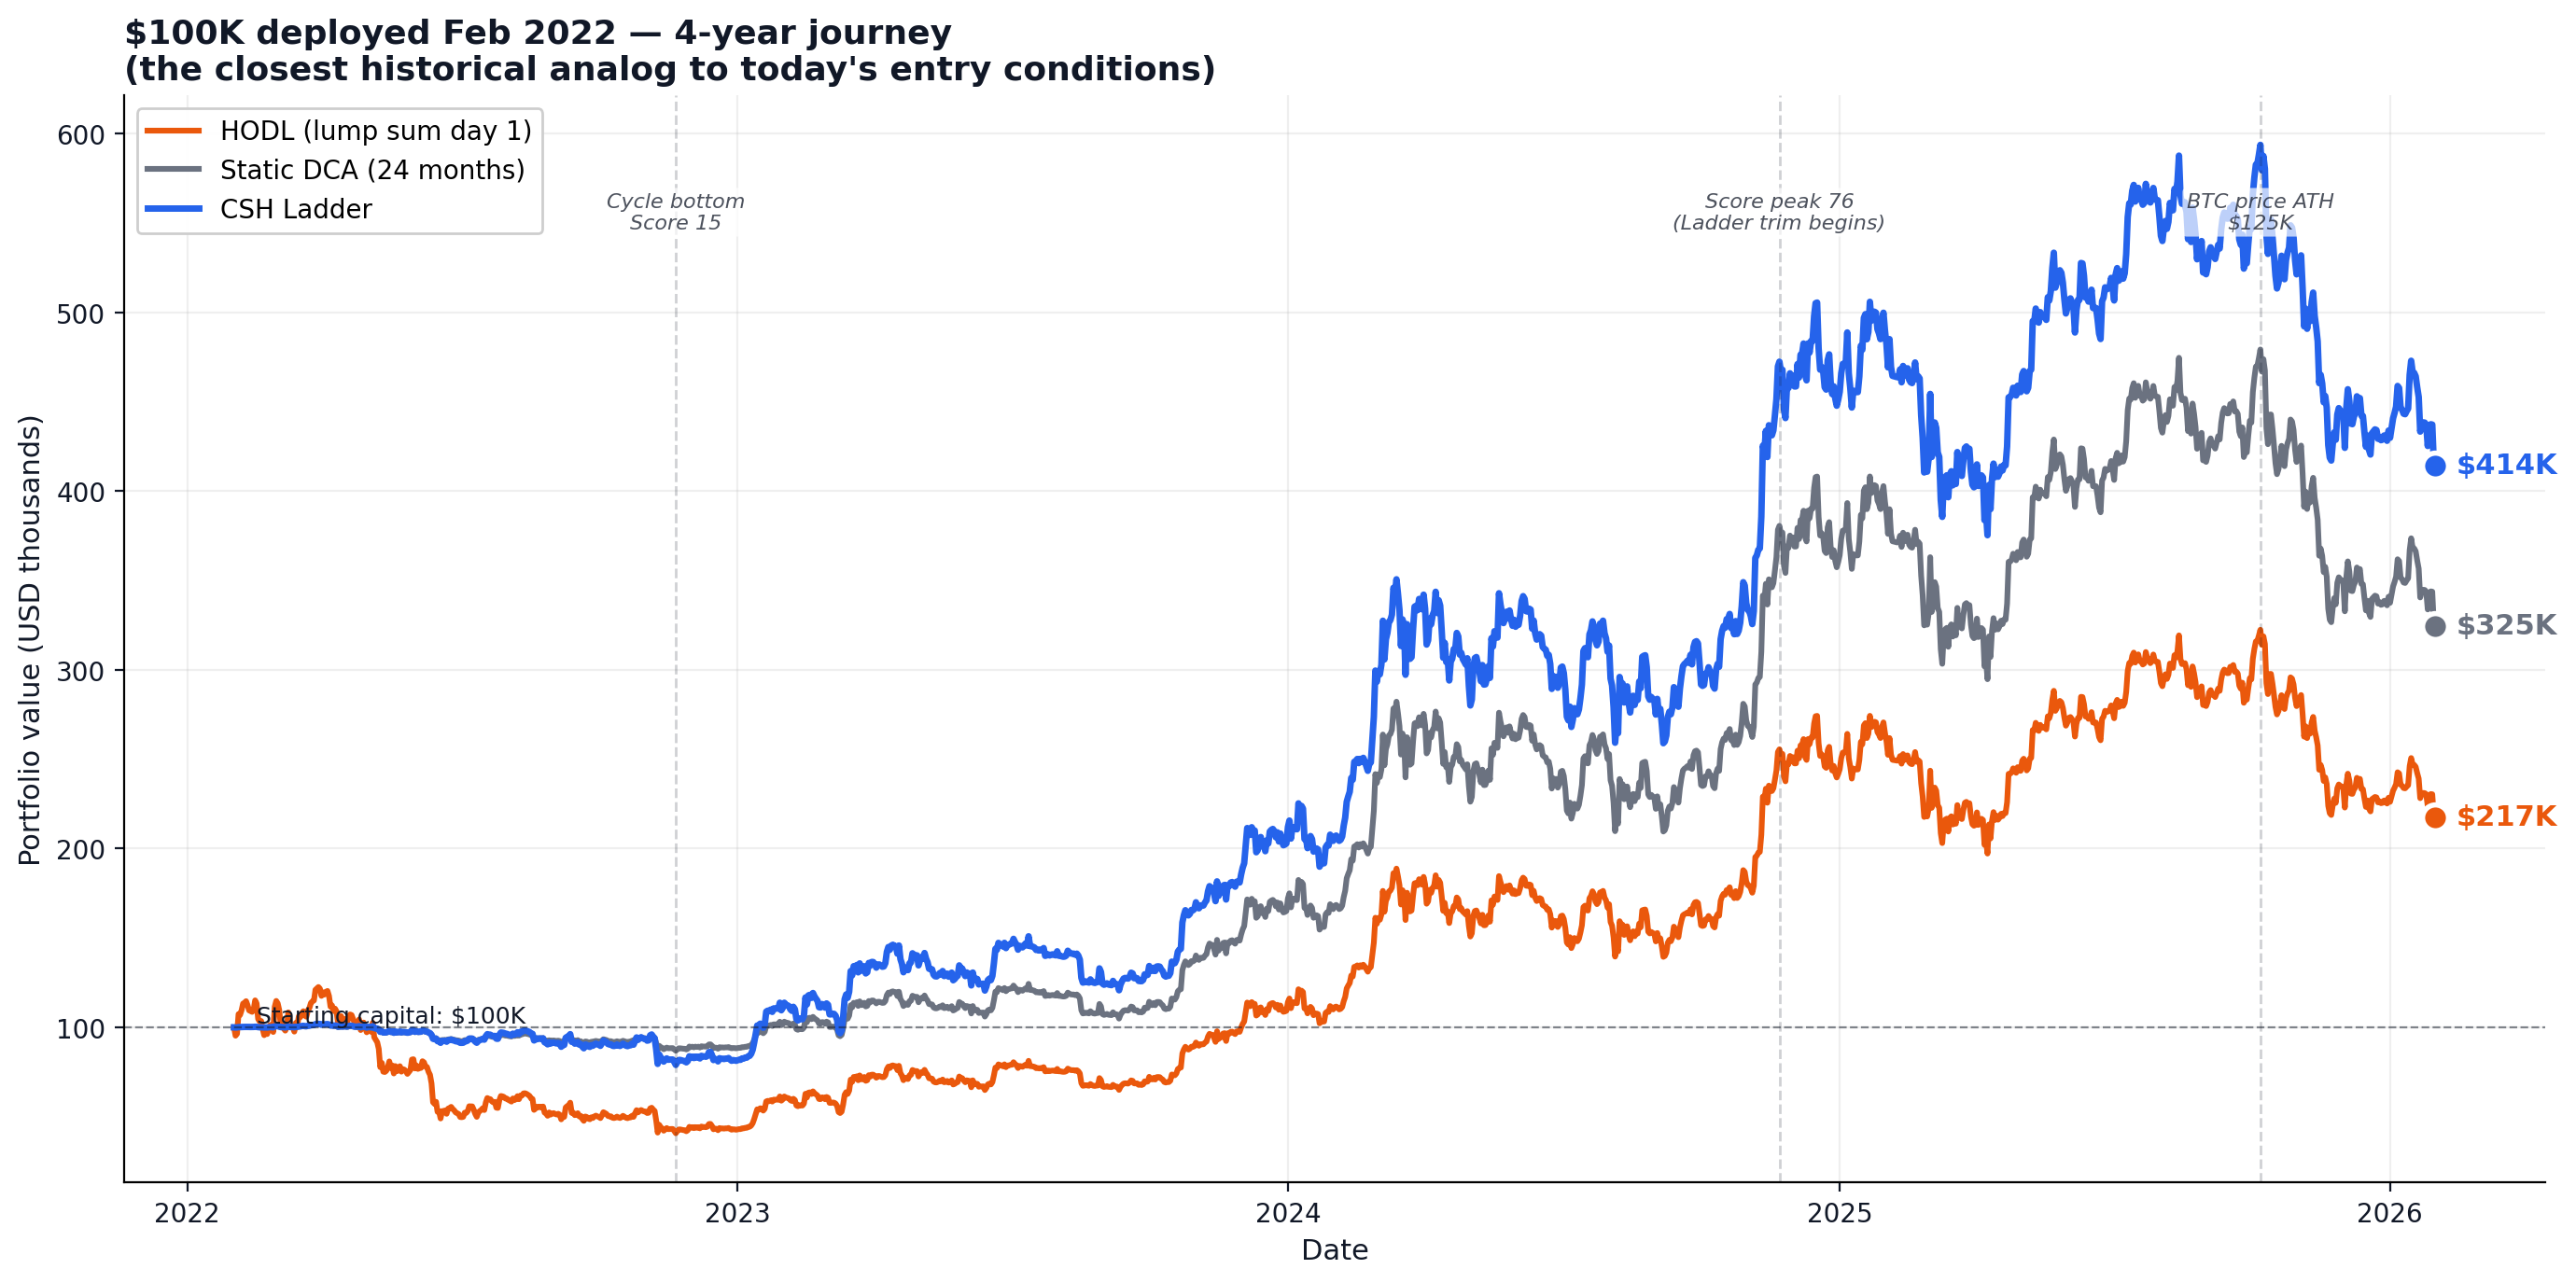
That’s not a guarantee for the next four years. Past distributions don’t lock in future ones. But it’s why I’m still running the rule even after seeing the median number.
I’d rather give up upside on the average case than risk the floor on the only case that’s actually mine.
Jake’s Workbench: The Plan Builder Is Live
Tom shipped the new Plan Builder this week. Biggest update we’ve made since launch.
Quick walkthrough.
The flow used to start with “what do you want to buy and how much.” The new one starts with “what does your goal look like” and runs through five steps: Goal, Plan type, Score range, Execution, Review. Each step is a real decision the system needs from you.
The headline new feature is Adaptive scaling.
Old version: pick an amount, set a schedule, buy on autopilot. The system told you when, you decided how much. That’s a static DCA wrapped in a CSH skin.
New version: pick your active Score range (the band where you want to be buying), pick your base order, choose how aggressively the system scales up at the lower end of your range.
Quick example: A$1,000 weekly base, set to 500% scaling. At the top of your range, orders fire at the base. At the bottom, they scale up to A$5,475. Same plan, dramatically different size depending on where the Score sits.
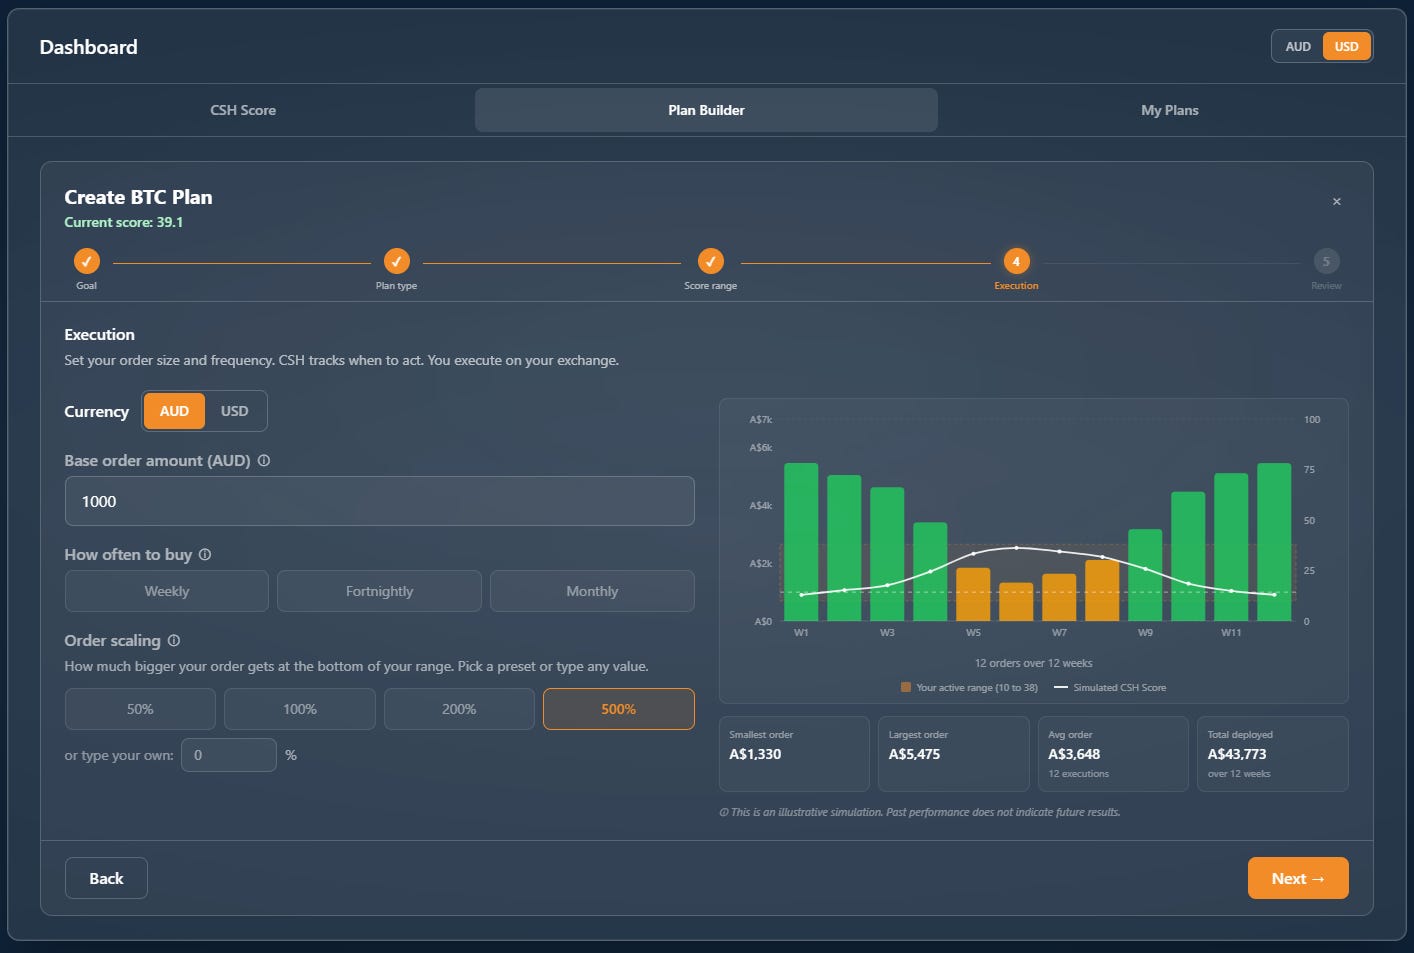
That’s the Adaptive rule. Same logic that beat Static DCA in 83% of backtest windows. Same one I’m running for my SMSF. Now you can build your own version of it in five steps.
Open the app, pick your range, set your scaling, and the system handles the rest.
Quick Hits
Bitcoin dominance still sitting at 60.93. Even with Bitcoin closing April up 11.87%, dominance hasn’t dropped meaningfully. So what: the rotation thesis keeps getting pushed back. Capital coming back into crypto is going to BTC first, ETF wrappers second, almost nothing into long-tail. If you’re holding alts waiting for them to “catch up,” the macro structure isn’t doing you any favours.
ETH/BTC at 0.02949. ETH bounced briefly above 0.031 in mid-April but has given the move back. The ratio peaked above 0.08 in 2021 and has been on a multi-year decline. So what: the historical pattern (BTC pumps, then ETH outperforms, then alts catch up) hasn’t fired this cycle. Either the rotation comes back hard or the framework is permanently broken.
Fed held at 3.50-3.75% in an 8-4 split. The most dissents at a single FOMC meeting since 1992. Three voted against the easing bias in the statement; one wanted a cut. So what: this isn’t a calm Fed. The committee is openly fractured on whether the next move is a cut or a hold-longer, and dissent ratio matters because it signals real divergence on inflation persistence. Same morning, Warsh cleared the Senate Banking Committee 13-11 along party lines, teeing up a full Senate vote.
Spot Bitcoin ETFs absorbed $2.44B in April. Strongest month of inflows in 2026, nearly double March’s $1.32B. So what: the marginal buyer is institutional and demand returned with force right as price was bottoming. CryptoQuant flagged the rally as futures-driven and called spot demand weak. That suggests the run-up has been leveraged speculation in front of the institutional bid, not because of it. Worth watching whether spot accelerates from here or fades.
The Week Ahead
Warsh confirmation vote, week of May 11. The Senate is out this week, so no movement until then. Warsh needs a simple majority and Republicans hold 53 seats. Powell’s term as Chair expires May 15, but he confirmed at last week’s press conference that he’s staying on the Board of Governors past then (his governorship runs to January 2028). So what: the Fed transition is now near-locked. The question is what tone Warsh sets at the June FOMC, and whether Powell’s continued presence on the board changes the dovish-hawkish balance.
April CPI release Tuesday May 12. March printed +0.9% month-on-month and +3.3% year-on-year. Sticky enough to keep the Fed cautious. A softer April number would give the rate-cut narrative a clean runway. A hotter print pushes cuts into the back half of the year.
ETF flows post-FOMC. Spot Bitcoin ETF flows are the cleanest read on institutional positioning right now. Watch for a divergence between price action and flow direction. If price runs but flows stay flat, it’s a retail rally. If flows accelerate, the institutional bid is back.
The Close
The Score moved this week. The plan didn’t. The Adaptive rule did exactly what it was designed to do. Same rule, different action, no decisions to second-guess.
I built a system that loses to HODL on the average outcome. I shipped it for my SMSF anyway. The math on the floor explains why.
Reply with the worst case you’ve built into your plan. The floor is the conversation worth having before the next leg down.
Plan Builder is live now. Build yours in five steps.
— Jake