

I spent last week on an island in Vanuatu with no signal and no charts. Came home to Bitcoin under $61K, the phones at work running hot, and our risk score sitting at a level I haven’t seen in years.
Funny thing about missing a week. You come back and see it clean, with none of the day-to-day noise that makes you flinch. And what I see is simple. This is the cheapest Bitcoin has been, on our framework, since the depths of 2022.
It might still get cheaper. But the thing we built CSH for is happening right now, and I’m acting on it. This is a longer edition than usual, because there’s a lot worth thinking through this week and I’d rather give it the room than rush it.
CSH Risk Dashboard
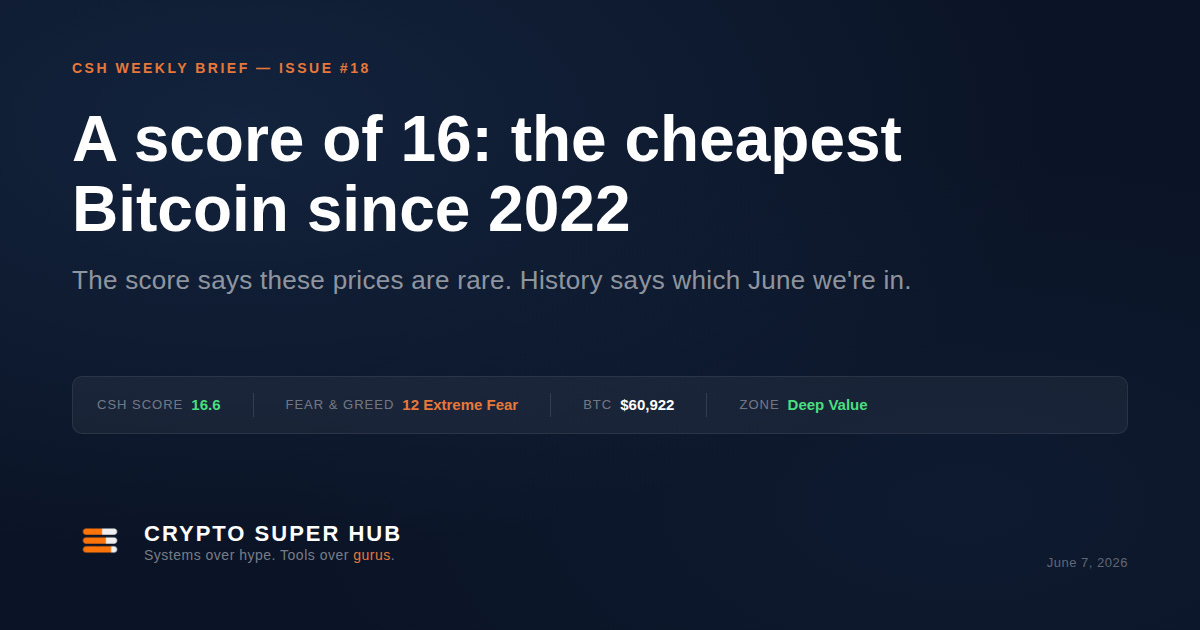
The CSH Score closed at 16.6 on Friday, with BTC at roughly $61K. That’s the bottom 2% of every reading since 2011.
Sit with that for a second. Out of fifteen years of daily data, only 2% of days have been cheaper on this measure. The last time we were down here was November 2022, post-FTX, score 15.0, Bitcoin at $15,781.
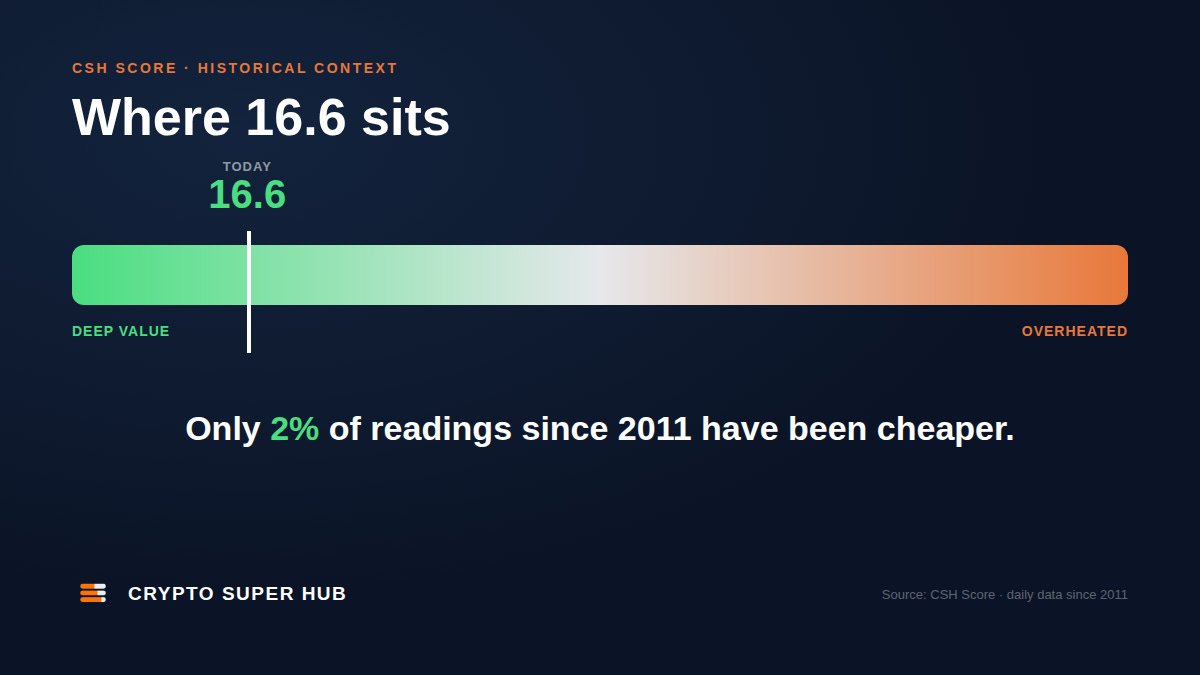
Here’s the part that matters and the part I won’t dress up. Back in February the score dipped under 20 and I called it a great entry. We’re now lower. Bitcoin is below its February low of around $62.8K, and the score at 16.6 is under February’s 18.9. So this isn’t the system taking a victory lap. February was a green light. This is a greener one.
The engine reads three things: where price sits against its long-term trend, which carries most of the weight, plus short-term momentum and the Fear and Greed Index. All three point the same way right now. Long-term position is deep in accumulation territory, momentum is stretched to the downside, and sentiment is in the dirt.
Plain English: the data says this is a buying zone, not a selling one. What the data can’t tell you is whether it gets cheaper first. That’s where history helps.
What the score says about June 2018 vs June 2022 vs now
This is the part you can’t get from a price chart, and it’s the whole reason we built the score.
People look at a falling price and panic. The score lets you ask a sharper question: have we been here before, and what happened next? Because we have fifteen years of daily readings, we can line up this exact moment against the same moment in past bear years and see how it actually played out.
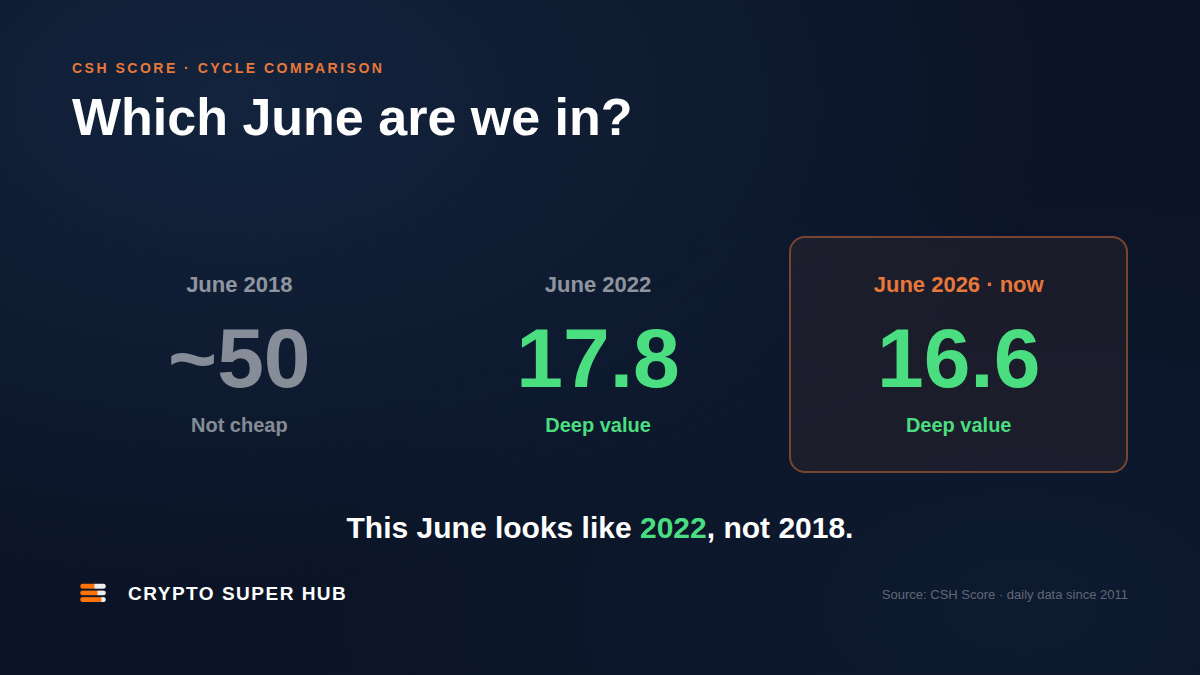
Start with June 2018. Price had fallen hard, sentiment was grim, and plenty of people called the bottom. But the score in June sat around 50. Not cheap. Middle of the range. Anyone reading the score honestly would have known the move wasn’t over, and it wasn’t. Bitcoin fell another 45% into a December bottom near $3,200, where the score finally dropped to 27. June looked scary. The score said it wasn’t cheap yet. The score was right.
Now June 2022. Different story entirely. The score hit 17.8 at the June capitulation low, deep value territory. From there Bitcoin chopped lower, FTX blew up in November, and price bottomed at $15,781. But the score at that final bottom was 15.0, only about three points below where it already sat in June. In other words, by June 2022 the score was already screaming, and the last five months were mostly price grinding sideways-to-lower while the reading stayed in the teens.
So which June does 2026 look like? It’s not close. We’re at 16.6 right now. That’s June 2022 almost exactly, and nothing like the ~50 of June 2018. The score is telling us we’re already in the deep-value zone, not staring down into it from halfway.
Here’s the payoff, and I’ve checked the numbers. Buying when the score was this low in past cycles worked, as long as you had patience. From the November 2022 bottom, Bitcoin was up 73% within six months and 179% within a year. From the December 2018 bottom, it was up over 300% within six months. The score didn’t call the exact day. It called the zone. And buying in the zone, then waiting, is the entire game.
None of this is a promise it repeats. It’s the honest historical context the score makes visible, and almost nobody else in this space can show you their data going back fifteen years. We can.
Why I’m buying here, and why I’m not going all in
I’m buying this week. Similar size to my February buy, into my SMSF, against the score the same way I always do. When the number goes below 20, I add. No timing the candle, no waiting for a feeling.
But I’m leaving plenty of dry powder, and here’s the honest reasoning.
June tends to mark a low in bear-market years. The final low usually lands later, roughly twelve months after the cycle top, which would put it around October. We tagged the all-time high of $124,774 last October. Do the maths and Q4 this year is exactly where you’d pencil in the real bottom if history rhymes.
So I think there’s time. I wouldn’t be shocked to see us test the 300-week moving average, the way we did in 2022 when price sliced clean through the 200-week and kept going. Right now we’re sitting right on the 200-week at about $61.8K. That’s the level everyone’s watching as the floor. The lesson from last cycle is that the level everyone watches doesn’t always hold.
This is the bit the loud accounts get wrong. It isn’t “back up the truck” or “it’s dead.” Both things are true at once. Buy here, because the data says these prices are rare. Pace yourself, because the cycle says you might get a better one. Whether you buy at $60K, $50K, $40K, or you split it across all three, in ten years you will be very happy you bought down here. The mistake is emptying the clip on day one and having nothing left when it really hurts.
That’s not indecision. It’s a plan you build before the emotion hits, which is the entire point of the system.
Jake’s Workbench
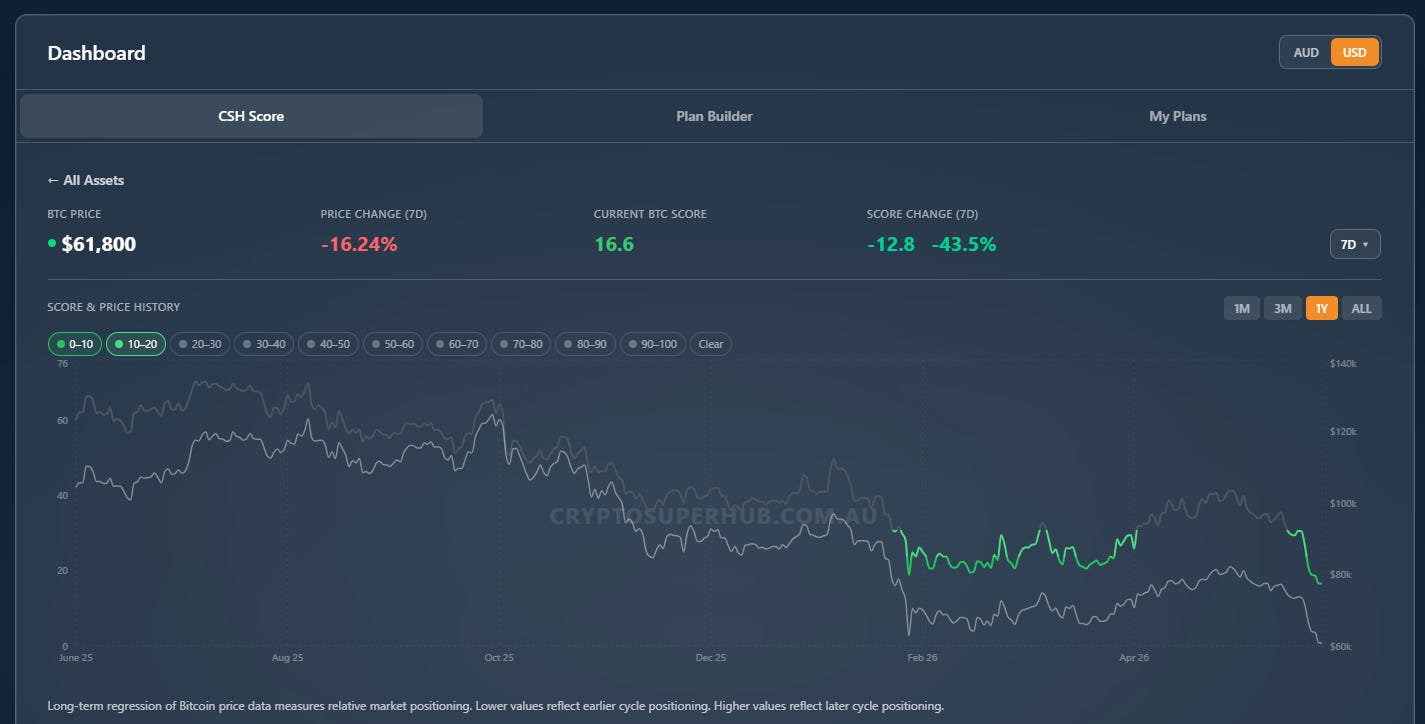
While I was offline, Tom shipped a proper upgrade to the score-and-price chart, and the timing turned out perfect for the cycle comparison above.
You can now drag to select any range on the chart and it snaps straight to that window. And we added clickable score-band pills above it, so you can highlight exactly where price sat when the score was, say, 10 to 20, and watch how rare those stretches actually are. The score line stays coloured through the bands you pick and greys out the rest.
So everything I just walked through with 2018 and 2022, you can now go and check yourself. Pull the chart, click the 10 to 20 band, and see every stretch we’ve been this low and what price did next. The week the score hits the bottom 2% is exactly the week you want people to be able to interrogate the history rather than take my word for it. The number on its own asks for trust. Letting you dig into the data earns it.
We build this at nights and on weekends. Seeing it go live the same week the framework is screaming its loudest signal in years is the good kind of coincidence.
Quick Hits
The altcoin temptation is real, and this week showed why it’s dangerous. A handful of names have outrun Bitcoin over recent months. Hyperliquid’s HYPE is up around 190% across 2026 and flipped Solana on price. Zcash, NEAR and Worldcoin all had strong runs. Then the music stopped. Arthur Hayes, who’d spent weeks loudly talking up HYPE, ZEC and NEAR as his “holy trinity” and even bet $100K that HYPE would beat Solana this year, dumped HYPE and NEAR on Wednesday, his entire ZEC bag on Thursday after a bug surfaced in Zcash’s Orchard pool, and his Worldcoin on Friday. WLD fell 28% in a day. Days earlier he’d posted “HYPE to $150.” That’s the alt game this deep in the cycle. The generational entries for alts will come. This isn’t the moment.
Stocks wobbled hard but they’re still up near records. The Nasdaq fell more than 4% on Friday, its worst day since early 2025, on a violent sell-off in chip stocks. Even so the S&P is still up around 10% on the year and sitting near all-time highs, so this is a pullback inside an uptrend, not a breakdown. The story is the divergence. Bitcoin couldn’t hold the line and just had its worst week since February, with a record run of ETF outflows. When an asset can’t rally with everything else near records, that tells you where it is in its own cycle.
Watch the liquidity drain from mega IPOs. There’s a wave of huge listings building, SpaceX, Anthropic and others reportedly lining up for late this year. Hayes flagged three mega AI IPOs between now and early Q3 as one reason markets could top before September. Big new issuance soaks up cash that might otherwise chase risk assets like crypto. Worth keeping on the radar.
The Week Ahead
Watch the 200-week moving average at around $61.8K. We’re sitting on it. A clean hold and reclaim would be the first sign the worst is behind us. Lose it with conviction and the 300-week comes into the conversation, which is the scenario I’m keeping dry powder for.
Watch the score. If it keeps sliding toward the low teens, that’s not a reason to panic, it’s the framework telling you the opportunity is widening. Below 20 I’m a buyer. Lower just means I buy again.
Watch the ETF flows. The record outflow streak is what tipped this week from a dip into Bitcoin’s worst week since February. If those flows stabilise, it’s an early tell that the selling is exhausting itself.
The Close
I came home to a market that had fallen out of bed and a risk score in the bottom 2% of all time. I’m not scared of that. The history says this June looks like 2022, not 2018, and buying the deep-value zone has paid the patient every time it’s shown up. So I’m buying it, carefully, with a plan I wrote before the fear arrived.
I’ve been reading The Bitcoin Standard this week, and it’s sharpened why I do any of this. Hard money, free markets, an exit from the slow squeeze of inflation and debasement none of us signed up for. That conviction is what makes a week like this feel like opportunity instead of disaster.
If you want to see where the score sits, pull the history yourself, and build a plan you can actually stick to when it gets ugly, create your free CSH account at cryptosuperhub.com.au.
Buy boring. Pace yourself. See you next week.
Jake