

Crypto Super Hub — Weekly Market Intelligence | Mar 8, 2026
I want to tell you about the dumbest investment decisions I’ve ever made. Not because I enjoy reliving them. Because every single one led to the system we built.
In 2021, I was buying altcoins at the absolute peak of the market. Not a little bit. I went deep into tokens I barely understood because everyone around me was up 300%. Within six months, most of those positions were down 80% or more. That same year, I put crypto into Celsius to earn yield. You know how that ended.
By 2022, I still hadn’t learned. Luna. Wonderland. Strongblock. Ponzi schemes dressed up as “innovative DeFi” with yields that should have been obvious red flags. They all went to zero.
It took three years of losses before I made the single best decision of my crypto career: a boring, monthly DCA into Bitcoin through my SMSF. No hype. No timing. Just a system. That position is still my best performer today, even after a 50% drawdown from the highs.
That journey from degen to disciplined is exactly why CSH exists. This week, I want to walk you through the whole thing.

CSH Risk Dashboard
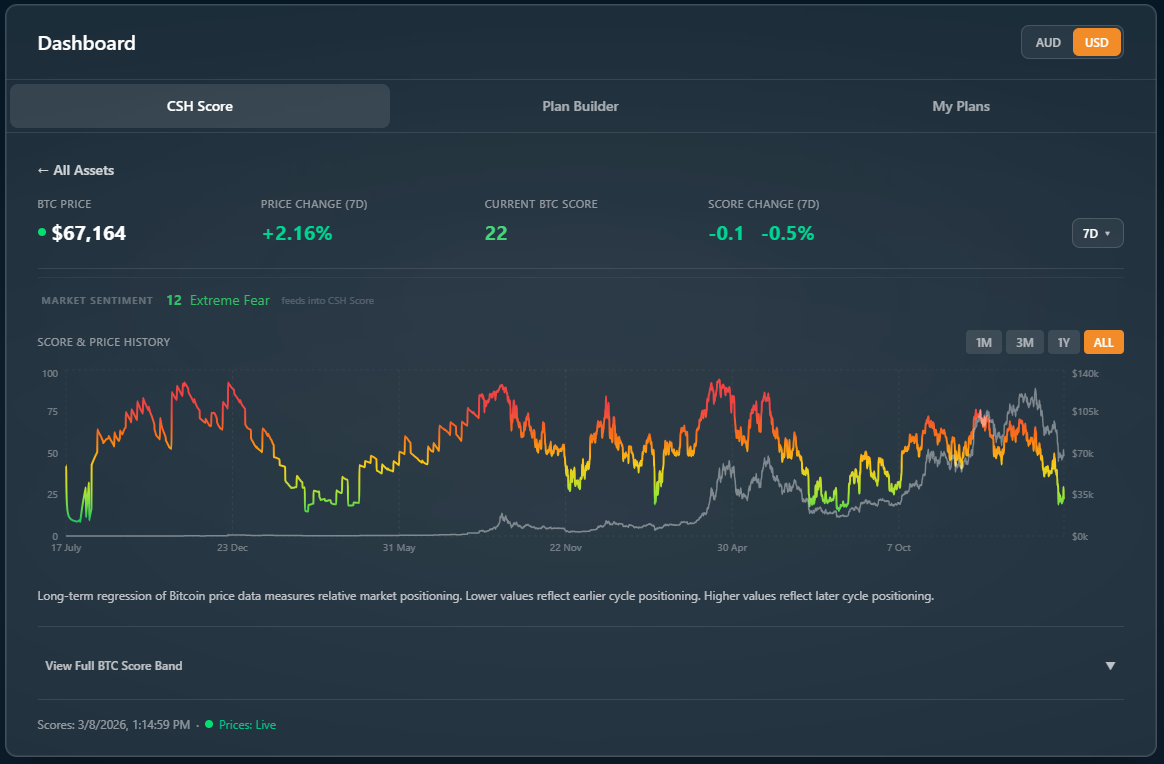
CSH Score: 22 / 100 | Accumulation Zone | Direction: Steady (-0.1 points, -0.5% over 7 days)
Before we get into the numbers, a quick product update. We’ve just shipped some significant upgrades to the CSH dashboard:
Score & Price History chart. You can now see the CSH Score and BTC price plotted together over time. The orange line is the score, the white line is price. Toggle between 1M, 3M, 1Y, and ALL views. This is the chart I wish existed when Tom and I were managing everything in spreadsheets. You can see exactly how the score has behaved across previous cycles, where it peaked, where it bottomed, and where we sit right now relative to that history.
Market Sentiment integration. The Fear & Greed Index now feeds directly into the dashboard. Right now it reads 12 (Extreme Fear). You don’t have to go hunting for it across three different websites anymore.
Time period toggle. Price change and score change now show movement across 7D, 30D, 90D, and 1Y periods. This week: BTC is up 2.16% over 7 days and the score has held steady at 22, barely moving (-0.1 points).
These aren’t cosmetic changes. They’re the tools that let you see context at a glance instead of piecing it together from five different sources.
This week’s callout: In Issue #3, we flagged that BTC could see a pump into early March based on the score positioning and historical bear market patterns. That played out almost exactly. BTC rallied from the low $60Ks to touch $74K before pulling back. The score doesn’t predict price, but it gave us the context to know conditions were ripe for a bounce. Now it’s sitting at 22. That’s right at the bottom of the accumulation zone. The last time the score was this low, it preceded one of the strongest accumulation windows of the cycle.
Key Risk Indicators:
Fear & Greed Index: 12 (Extreme Fear)
BTC Price: $67,164 (7d: +2.16%)
BTC Dominance: 56.5%
Total Crypto Market Cap: $2.38T
ETH/BTC Ratio: 0.029
Jake’s Read: The score is sitting at 22, right at the bottom of the accumulation zone and just above the 0-20 deep value threshold. Fear & Greed is at 12, lower than the COVID crash, the 2022 crypto winter, and almost every other fear event in Bitcoin’s history. The CSH Score at 22 is confirming what the sentiment is telling us: conditions are historically favourable for accumulation. If you have a plan active in the 0-45 range, it should be running. If you have a dynamic plan that triggers below 20, it’s one bad week away from firing. This is the kind of reading you’ll wish you’d acted on when the score is sitting at 70.
How 5 Years of Mistakes Became the CSH System
Most crypto “education” starts with someone telling you what to buy. We started with a different question: how do you know when to buy and when to sell?
After my string of losses in 2021-22, Tom and I started asking: what if we could measure where we actually are in the cycle? Not guess. Not follow someone else’s opinion. Actually measure it.
The CSH Score: a thermometer for the market. We built a number from 0 to 100 that tells you where a crypto asset sits in its market cycle, based on its relationship to its long-term growth trend. Low scores (0-30) mean the asset is trading well below trend. Historically, the best times to accumulate. High scores (60-100) mean it has run well above trend. Time to be cautious. It’s not a buy or sell signal. Think of it like checking the weather before you leave the house. Right now, BTC sits at 22. Bottom of the accumulation zone. Historically one of the strongest areas for building positions.
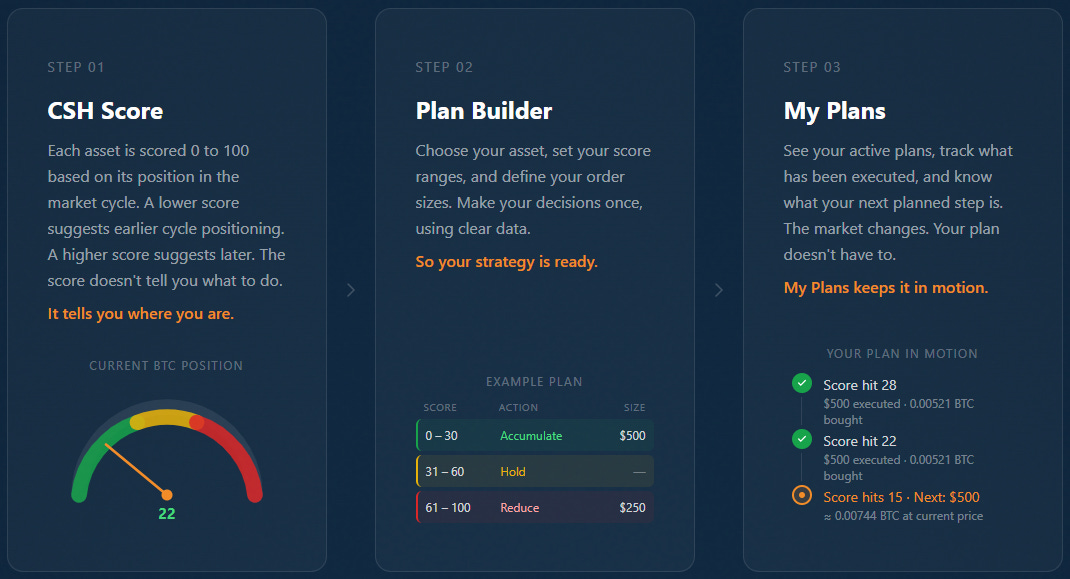
From score to strategy: the Plan Builder. A score alone doesn’t do anything unless you have a plan that responds to it. The Plan Builder lets you create fixed plans (set dollar amount, regular interval, only executes when the score is in your range) and dynamic plans (order sizes adjust based on the score level, buying more when conditions are stronger). Personally, I run a fixed accumulation plan as my base: consistent weekly buys when the score is below 45. On top of that, a dynamic plan that adds extra buys if the score drops below 20. And a distribution plan ready for when the score eventually pushes past 70. Three plans, three different jobs.
Back in 2024, Tom and I were doing all of this with spreadsheets. Entry risk bands, price levels, exit targets. It worked in theory. In practice, it was a nightmare to update and manage. When AI exploded in early 2026, we saw the chance to package our dynamic DCA approach into software. Five years of mistakes and spreadsheets, turned into an app.
The weekly workflow: 5 minutes. Check the score. Review your plans. Execute any triggered orders on your exchange (we recommend Coinstash for Aussie investors). Log it. Move on. That’s the whole point of having a system.
The full deep dive on all three tools is in our Skool community course guides. Step by step, plain English, no PhD required.
Jake’s Workbench
The 30-Day AI Mastery Experiment
We published a piece on X this week walking through our AI content system. Claude Pro ($30/month) as the brain, Notion ($20) as the memory, Typefully ($10) for scheduling. $60/month for a full publishing operation. The same “build systems, not rely on gurus” philosophy we apply to investing, applied to content.
The AI/content crossover posts continue to be our highest-performing content. The last one hit 249K impressions. People want the practical “how,” not the hype.
The irony: the same approach we’re building for crypto investing (systems over signals, frameworks over feelings) is exactly how we’re building the business. AI isn’t replacing the thinking. It’s removing the bottlenecks.
Quick Hits
Energy shock is the macro story nobody’s pricing correctly. Oil is up roughly 60% in four months. If the Iran conflict persists or the Strait of Hormuz gets disrupted, US CPI could push back above 3.0%. That would kill the rate cut narrative and put global GDP growth at risk. Asia is particularly exposed given its dependence on Middle East energy imports. So what: Higher oil means stickier inflation means tighter money for longer. That’s the single biggest headwind for crypto right now.
The US economy is showing cracks beneath the surface. Labour data has been soft: job losses, sector contractions, and rising safe-haven demand. Money market funds are at record levels as capital rotates out of risk. Credit markets are showing weakness in tech and private markets. Put-call skew among institutional investors is at elevated levels, meaning the smart money is hedging aggressively. So what: This backdrop explains why the Fear & Greed Index is at 12. The economy is softer than headlines suggest.
Bitcoin ETF inflows have reversed sharply. After six weeks of outflows that drained roughly $4.5 billion, spot Bitcoin ETFs pulled in $500 million on March 5 alone, the best single day of 2026. Ten of eleven funds posted positive flows simultaneously. So what: Institutions are rotating back in even as macro uncertainty builds. When flows shift from concentrated (just IBIT buying) to broad-based, that typically signals genuine sentiment change.
Geopolitical wildcard: Trump’s deals are reshaping the map. Deals with Venezuela and Russia on one hand, tensions with allies like Spain on the other. Markets are pricing de-escalation in the Middle East, but volatility is building underneath. If the de-escalation bet is wrong, the repricing will be sharp. So what: Geopolitics is driving macro, macro is driving crypto. Your system should be making decisions here, not your gut.
The Week Ahead
March 11: US CPI Release (Feb data). This is the big one. January came in at 2.4%, but with oil up 60% in four months, the energy component could push February’s print higher. If CPI crosses back above 2.7%, the rate cut narrative is dead for the first half of the year. If it holds in the low 2s, risk assets breathe easier. Either way, this number sets the tone for everything that follows.
March 17-18: FOMC Meeting. Prediction markets are pricing a 99% chance of no change to rates. The decision itself probably isn’t the story. What matters is the Fed’s commentary on the inflation path given the energy shock, and whether Powell signals any concern about labour market softening. The dot plot and forward guidance will move markets more than the vote.
Oil and the Strait of Hormuz. If the Iran conflict escalates further, oil could push toward levels that force a genuine inflation repricing globally. Asia is most exposed given its energy import dependence, but the knock-on effects hit everywhere. Watch Brent crude as closely as you watch BTC this week.
$65K-$72K range for BTC. The market has been compressing in this band for weeks. ETF inflows are back, but whale profit-taking and macro uncertainty are capping the upside. A decisive break either way could set the tone for the rest of March. If $65K breaks on a hot CPI print or geopolitical escalation, $60K is the next support. If $72K breaks on dovish Fed language, $75K resistance is the test.
The Close
Five years ago, I was buying ponzis and parking crypto on Celsius. Today, Tom and I have built a system that takes the emotion out of the exact decisions that cost us the most.
If any part of that story sounds familiar, you’re exactly who we built this for.
See you next week.
— Jake
Crypto Super Hub. Understand your crypto. Build your own plan.
This newsletter is for informational purposes only and does not constitute financial advice. Always do your own research before making investment decisions.