



October is meant to be Uptober.
Bitcoin had just run 48% off its July low and closed a week back above its 50-week moving average. Then it stalled. It closed at about US$86,600 on 22 September, and four weeks later it’s lower. This week it briefly dipped under US$80,000 and slipped back under the May high, around US$83,000.
My read for the next few months isn’t Uptober. It’s Choptober.
That’s not a bearish call. In a bull market, Bitcoin spends more time going sideways than going up, and I went back through our score history to see how much more. The answer’s below, along with why I think this stretch is the best part of a bull market to be buying.
If you want a plan that keeps buying through the chop without you deciding each week, you can try every feature in the CSH app free for two weeks.
CSH Risk Dashboard
CSH Score: 33.1 this morning, down 2.1 on last Sunday
Bitcoin: about US$81,500, down 2.4% on last Sunday
May high: about US$83,000, and Bitcoin is just under it
50-week moving average: about US$76,500, and falling
Bull market support band: about US$71,500 to US$76,200
Price at a CSH Score of 30: about US$79,400 (the app’s price map, 18 October)
The CSH Score rates where Bitcoin’s price sits in its own history, from 0 to 100. At 33 it’s still in the bottom third.
My plan kept buying this week with the CSH Score between 30 and 35. Under 30 the orders get bigger, and that’s the level I’m hoping we get to.
What a bull market pause looks like
Pull up a chart of the last few bull markets and you’ll see the same shape. A big, fast move up. Then months of going sideways and down while the market consolidates. Then the next big move up.
To test it, I found the week in each bull market when Bitcoin first closed back above its 50-week moving average after the bear. This cycle, that was 20 September. Here’s what came next each time.
2015 to 2016. Bitcoin closed back above the 50-week MA in October 2015 and ran to about US$465 by mid-December. Then it went sideways for four months, falling as much as 21% (to about US$366 in February). It never closed a week under the 50-week MA, and the CSH Score stayed between 9 and 18 the whole time. When it broke out, Bitcoin got to US$767 by June 2016.
2023. This is the one I keep coming back to. Bitcoin closed back above the 50-week MA in March 2023 and ran to about US$30,500 by mid-April. Then it went sideways for six months, down as much as 18% (about US$25,100 in June). It never closed a week under the 50-week MA, and the CSH Score stayed between 15 and 31. It broke out in late October, and by March 2024 Bitcoin was at US$73,000.
2019 to 2020, the warning. Bitcoin closed back above the 50-week MA in May 2019 and ran to about US$12,900 by late June. That pause lasted 16 months and included the COVID crash. At the worst of it, in March 2020, Bitcoin was down 61% at about US$4,960, and it closed 11 weeks under the 50-week MA along the way. The next leg still came, to US$63,000 by April 2021. It just felt nothing like a pause in March 2020.
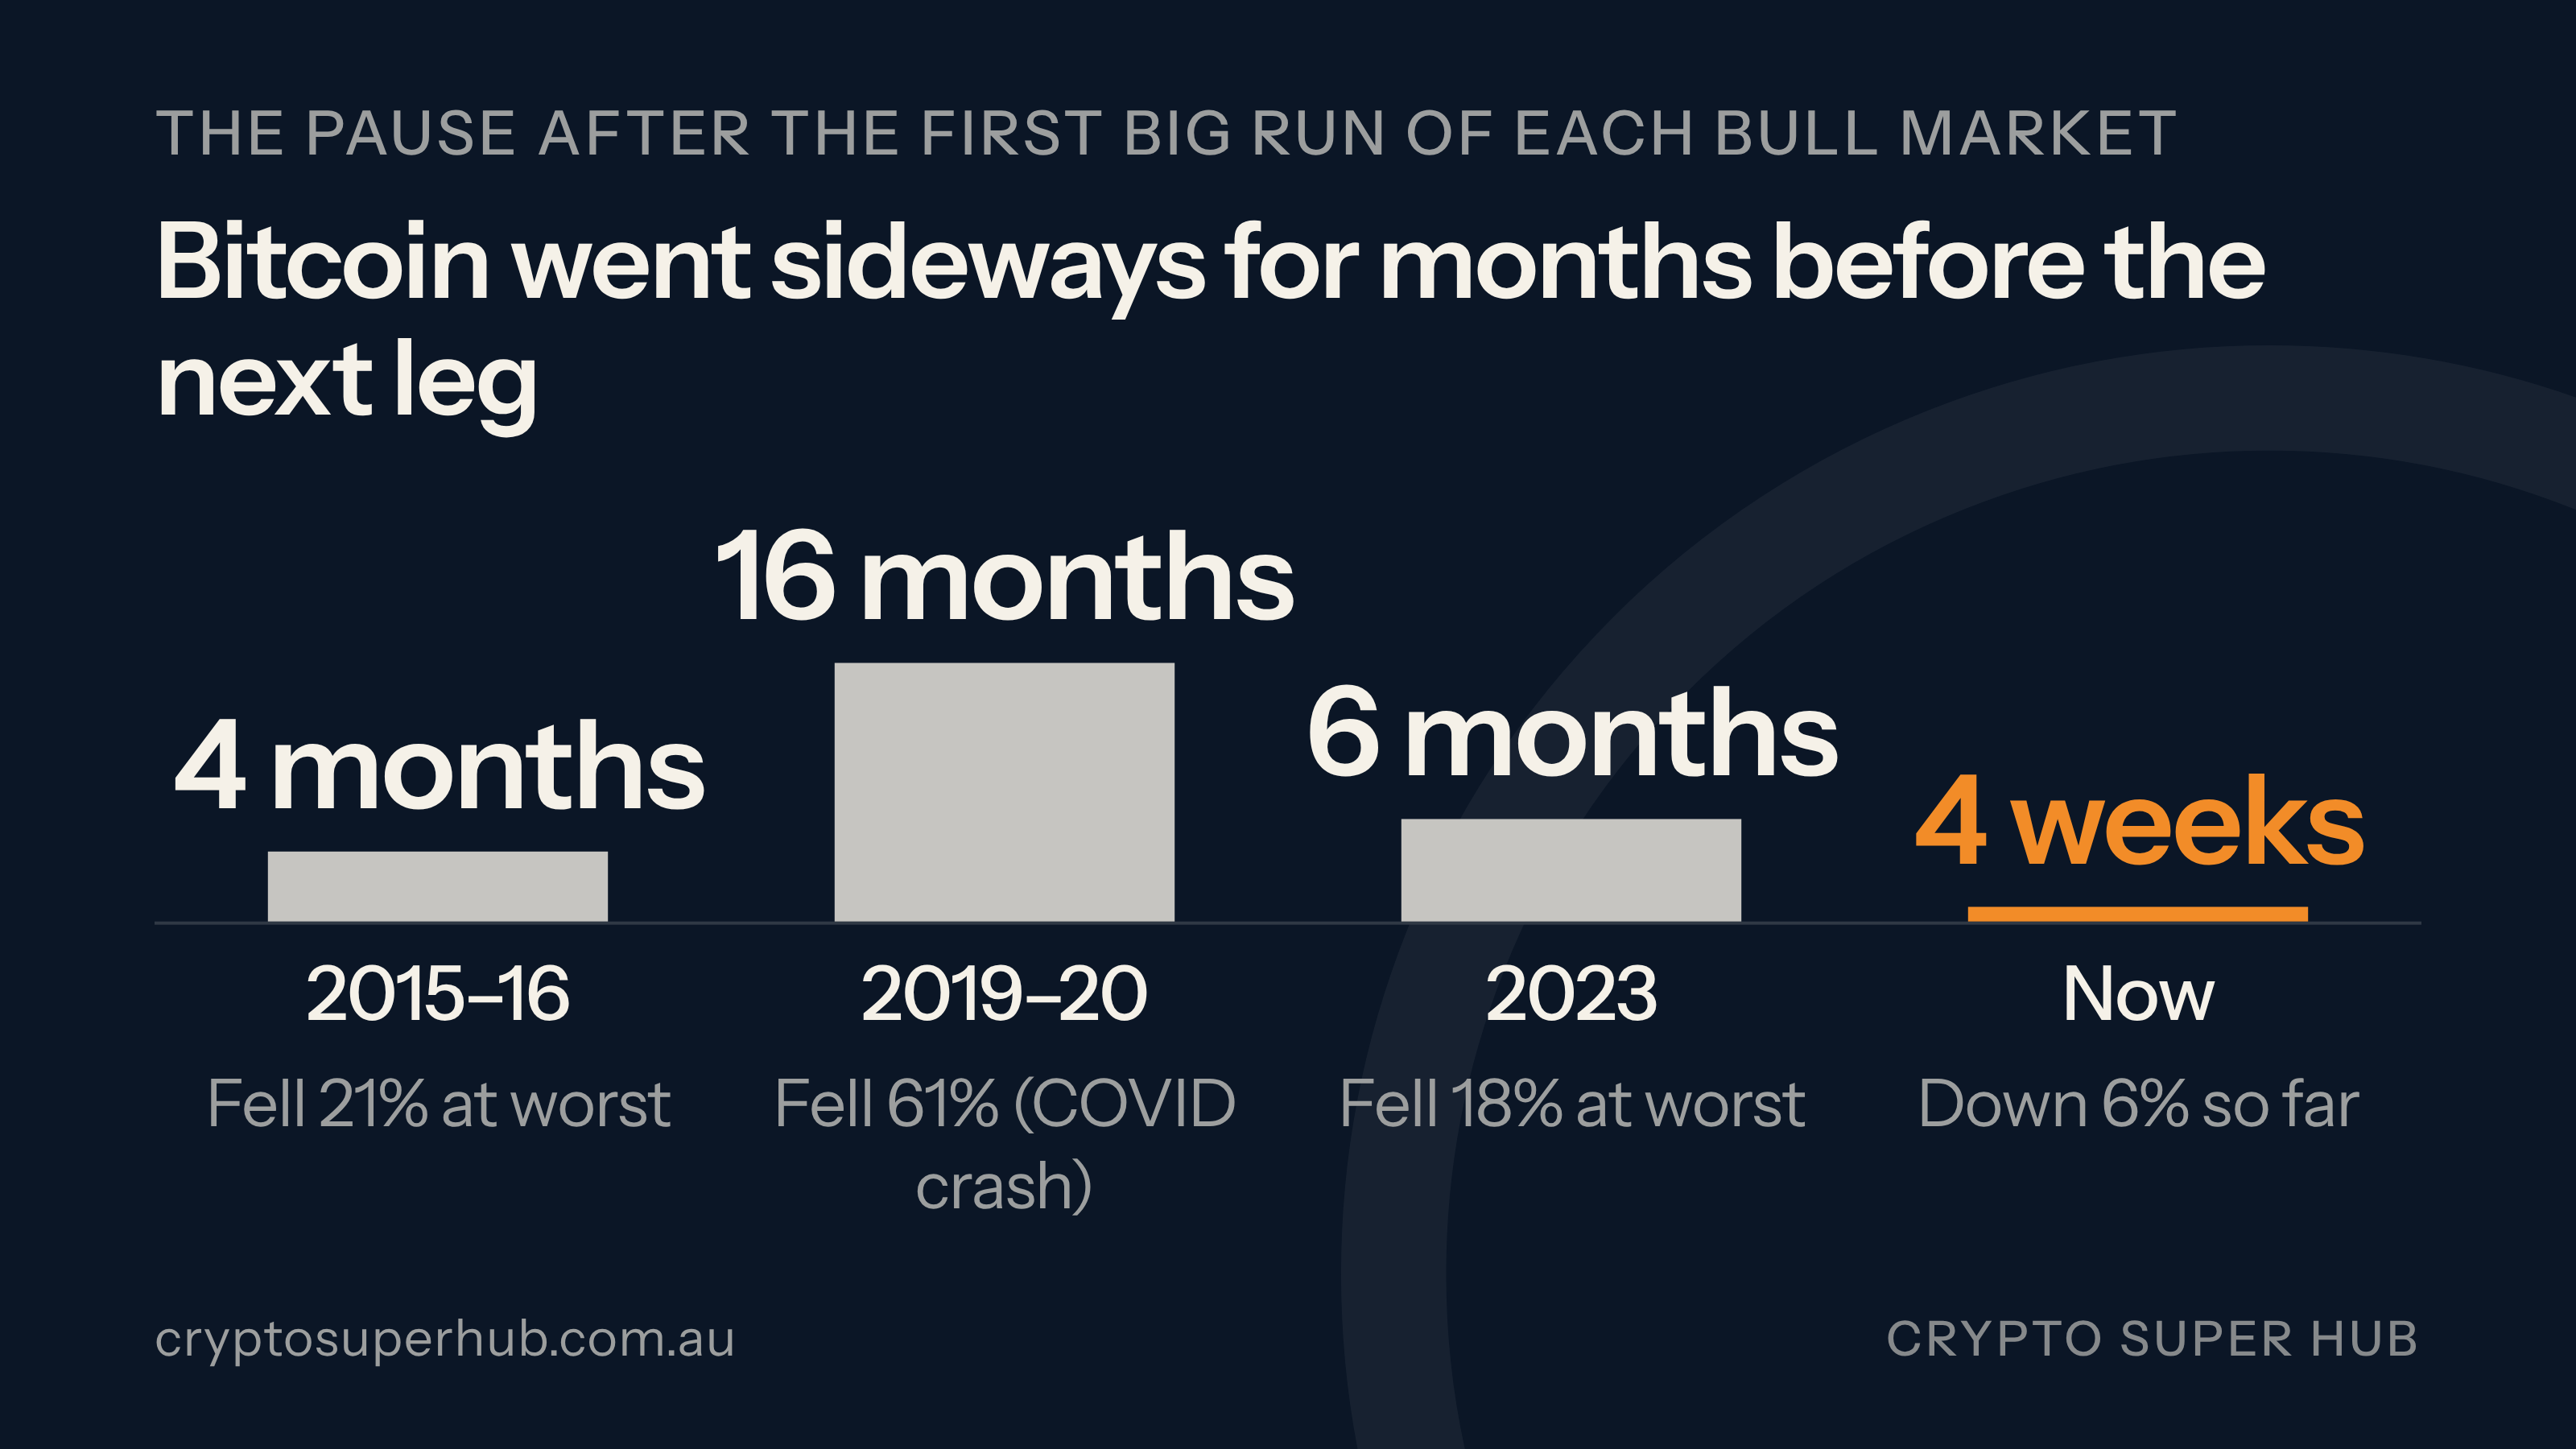
Zoom out to each whole bull market, from the bear market low to the top, and it’s the same story. In each of the last three, Bitcoin spent at least half its days stuck under an earlier high, in stretches of two months or more: 50% of the 2015 to 2017 bull market, 70% of 2018 to 2021, and 53% of 2022 to 2025. The moves up happen fast. Most of a bull market is spent waiting for the next one.
This pause is four weeks old. Bitcoin is down 6% from its 22 September close, the CSH Score has stayed between 33 and 38, and Bitcoin is still above both the 50-week MA and the bull market support band (the 20-week and 21-week moving averages traders watch in a bull market).
Why I’d rather buy the chop
In the 2015 to 2016 and 2023 pauses, the CSH Score never went above 31. A plan that buys under a Score of 45 bought every single week of both.
In 2023 that’s 28 weeks of buys at an average of about US$27,900. Less than five months after the pause ended, Bitcoin was at US$73,000.
None of it felt good at the time. By June 2023 Bitcoin was down 18% from the April high, and every buy since mid-April was underwater. If you sold then, you sold at around US$25,000 and watched it get to US$73,000 by March 2024. And at the COVID low in 2020, it would have felt like the bull market was over.
These are past cycles, read with today’s model of the CSH Score. They show what pauses have looked like, not how long this one will last.
Two paths from here:
Bitcoin holds above its 50-week MA, about US$76,500, and goes sideways between there and the September high for a few months. That’s 2016 and 2023.
Bitcoin closes a week under the 50-week MA and the support band and keeps falling. That’s closer to 2019.
My plan does the same thing on both paths. It buys while the CSH Score is under 45, and the lower the Score goes, the bigger the orders.
What’s weighing on it
Most of what’s dragging on Bitcoin right now isn’t crypto news.
US inflation came in hot on 14 October: 3.7% for September, against 3.6% expected. The US 10-year Treasury yield briefly went above 5.3%, and markets jumped to about even odds of another Fed rate rise at the 27 to 28 October meeting, before those odds fell back under 20% by Friday. Oil is part of why inflation won’t settle. US crude closed the week at about US$101 a barrel on Middle East supply worries, and higher oil feeds straight into prices. Then the AI trade cracked. CoreWeave fell about 25% in five sessions as investors questioned whether AI infrastructure companies can repay what they’ve borrowed, and the Nasdaq 100 fell 5.5% for the week.
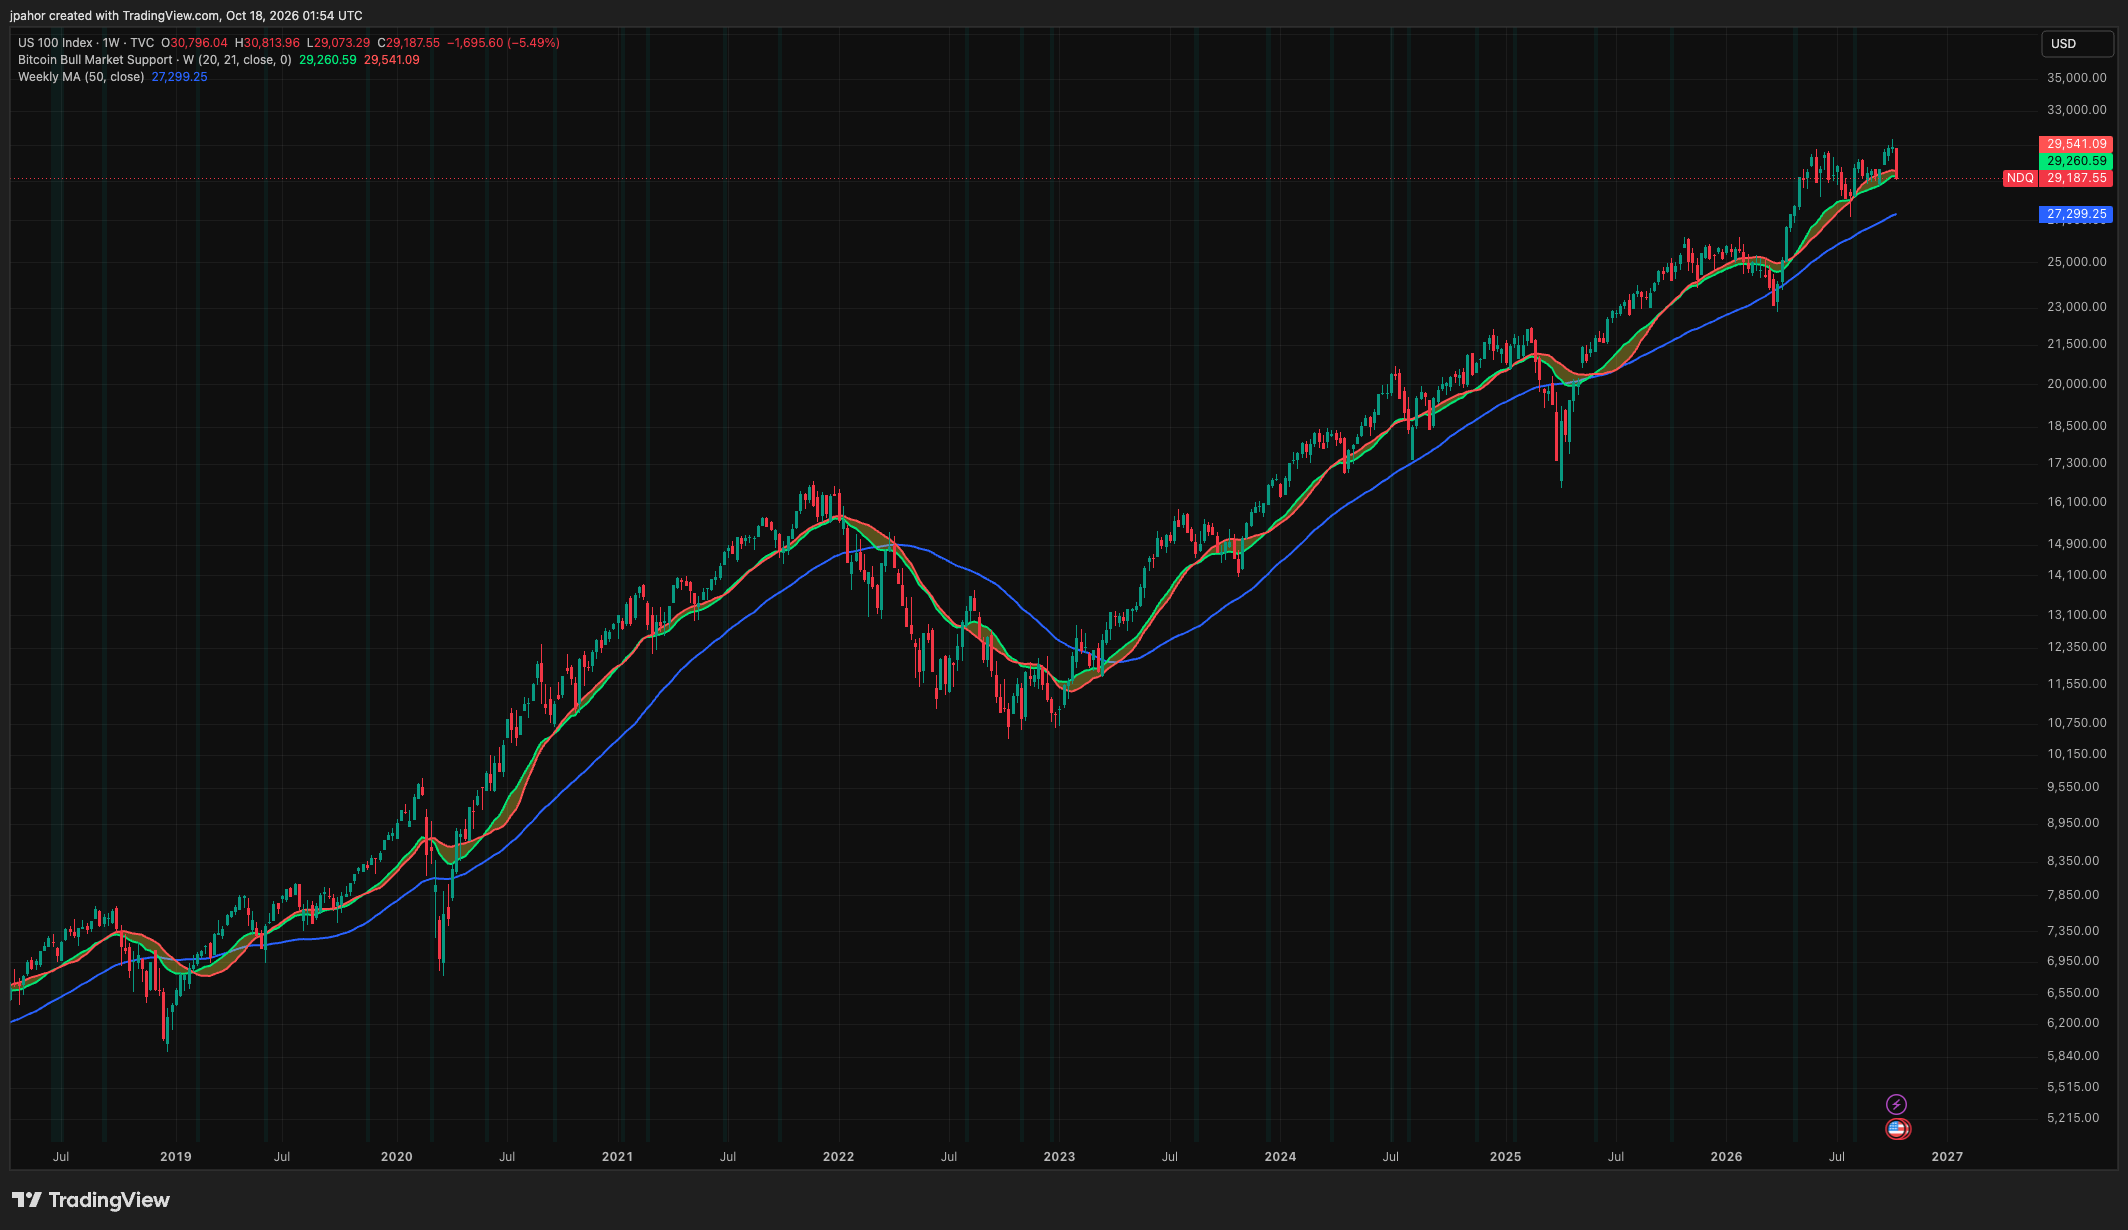
Three charts I’m watching, all weekly, from my TradingView this morning.
The Nasdaq 100 closed at 29,188, just under its bull market support band (29,261 to 29,541). Its 50-week MA is about 6.5% lower, at 27,299. A weekly close back above the band keeps its uptrend intact. Losing the band puts the 50-week MA in play. Bitcoin fell with tech stocks this week, so this is the chart I’d watch first.
Bitcoin’s share of the whole crypto market rose to 60.6%, above its 50-week MA and support band (all three sit between 59.3% and 59.6%). It’s spent more than a year mostly between 58% and 61%.
And the flip side: altcoins against Bitcoin. Add up the value of every coin except Bitcoin, Ethereum and USDT, price it in Bitcoin, and you can see whether alts are gaining on Bitcoin or falling behind. That ratio fell 4% this week to 0.36 and closed under its 50-week MA and support band. Ether measured in Bitcoin did the same, down 2.6% to 0.0295. In the last two cycles, alts kept losing ground to Bitcoin until that ratio got down to around 0.25, in late 2019 and again at the end of 2020. This cycle it never got there. It’s been mostly between 0.33 and 0.40 since August 2025, and this week it’s slipping.
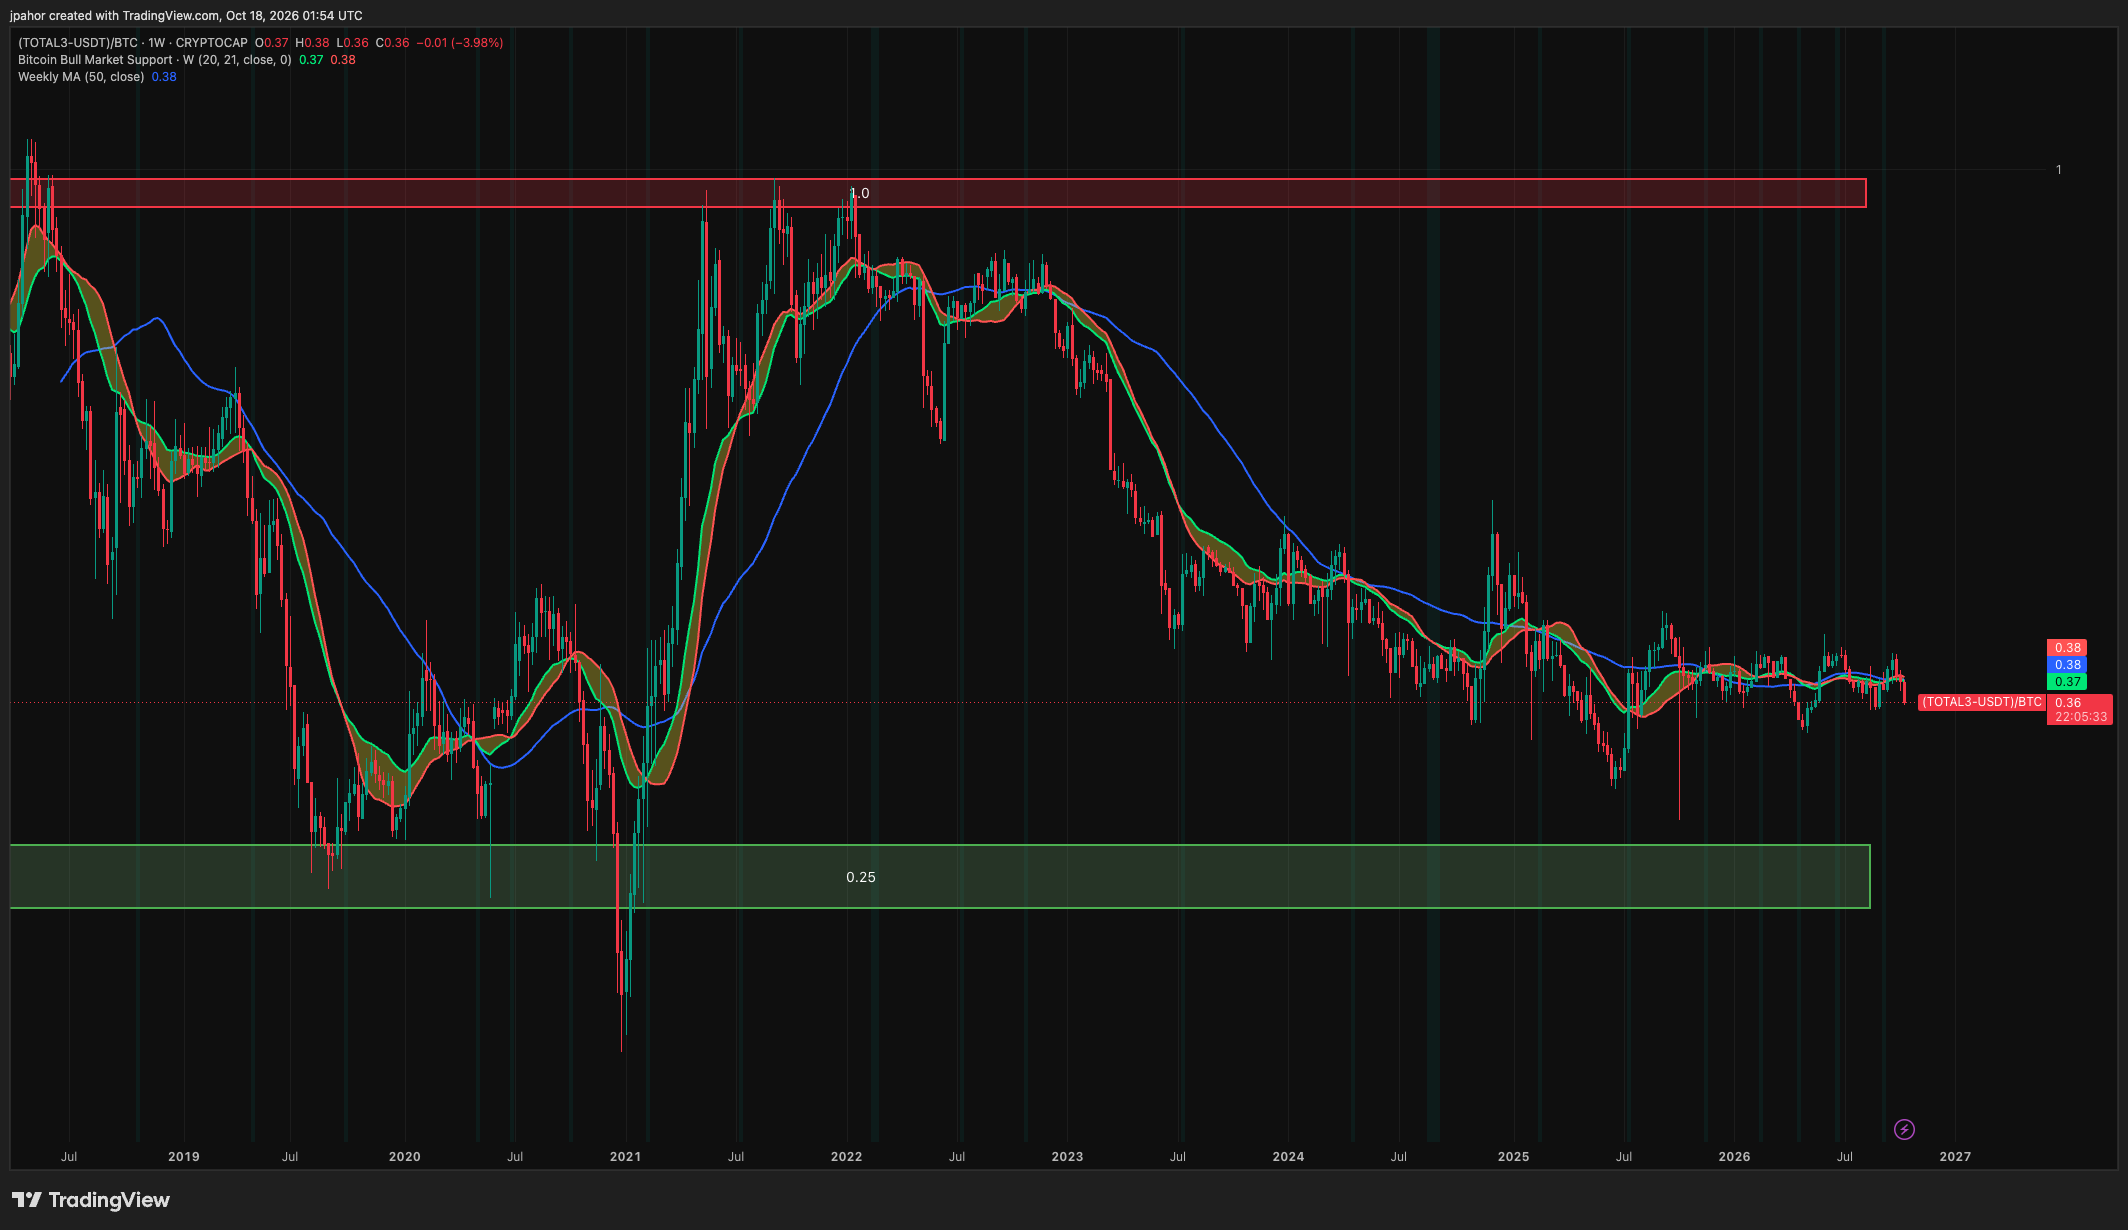
Put the three together and money inside crypto is moving towards Bitcoin while the Nasdaq wobbles. I only buy Bitcoin for now, so none of this changes my plan. I’d consider alts at the right opportunity, and this is the chart I’m watching for it.
Jake’s Workbench: the cash I haven’t put in yet
I still have cash to deploy. I’m not putting it all in at US$81,000, and I’m not sitting on it waiting for a crash either.
My plan decides. It buys every week while the CSH Score is under 45 and puts more in under 30. If we get a dip under 30, it buys more without me having to talk myself into it. If we don’t, I’ll still have bought through the chop.
Quick Hits
14 Oct: US inflation 3.7% for September, 0.1 above forecasts. The 10-year yield briefly topped 5.3%.
16 Oct: CoreWeave fell 12% on the day and about 25% over five sessions, with its bonds yielding above 15%.
Week to 16 Oct: spot Bitcoin ETFs had net outflows on three of the four days reported, the biggest about US$261 million on 14 Oct.
Oil: US crude closed the week at about US$101 a barrel, Brent about US$110.
Nasdaq 100: down 5.5% for the week.
Week Ahead
Mon 19 Oct, 10am: Bitcoin’s weekly close. Finishing the week back above the May high, about US$83,000, would be a good start.
Mon 19 Oct: China’s September-quarter GDP.
Thu 22 Oct, morning our time: chipmakers Lam Research and Texas Instruments report, after this week’s chip sell-off.
Wed 28 Oct: Australian inflation for the September quarter.
Thu 29 Oct, 4am: US Fed rate decision.
Fri 30 Oct, 6pm: monthly Bitcoin options expiry on Deribit, about US$11 billion.
Sat 31 Oct: first annual return due for SMSFs set up last financial year, and the Mt Gox repayment deadline.
The Close
Nobody knows if this pause lasts four weeks or six months. Two of the last three lasted four to six months. One lasted 16.
That’s why I don’t try to guess how long it lasts. I wrote down what my plan does in every week of it: buy while the CSH Score is under 45, and buy more under 30. So when Bitcoin has a red week, I’m not sitting there wondering whether this is the dip. My plan has already bought it.
Where are you at? Hit reply with 1, 2 or 3:
Buying through it
Waiting for a lower CSH Score
Haven’t got a plan yet
If you want your own plan doing this for you, you can try every feature in the CSH app free for two weeks.
Crypto Super Hub is general information and education only. Nothing here is financial advice, and it doesn’t take your objectives, financial situation or needs into account. Crypto is volatile and you can lose money. Past performance doesn’t guarantee future results. Do your own research and consider speaking with a licensed financial adviser before making investment decisions. We hold Bitcoin ourselves, so assume we’re biased.