

Crypto Super Hub — Weekly Market Intelligence | May 10, 2026
I work at a crypto exchange full time. The job is a front-row seat to market psychology.
When BTC dumped to $60K in February, our phones went quiet. No new accounts. Existing customers went silent. Cheapest BTC in 18 months and nobody wanted to touch it.
Three months later we’ve rallied 30%. May has been one of our busiest months of the year. New accounts. Old accounts re-funding. The same people who couldn’t be paid to buy at $60K are now buying at $80K.
Most people invest with the heart, not the head. Not because they’re stupid. Because they don’t have a system to point them the other direction when feelings are loudest.
That’s why CSH exists.
And it’s why I’m watching this rally carefully. I’ve seen this setup three times before. The pattern doesn’t change.
Is this a bear market rally?
CSH Risk Dashboard
BTC: $80,678 | CSH Score: 40.3 | Sentiment: Neutral
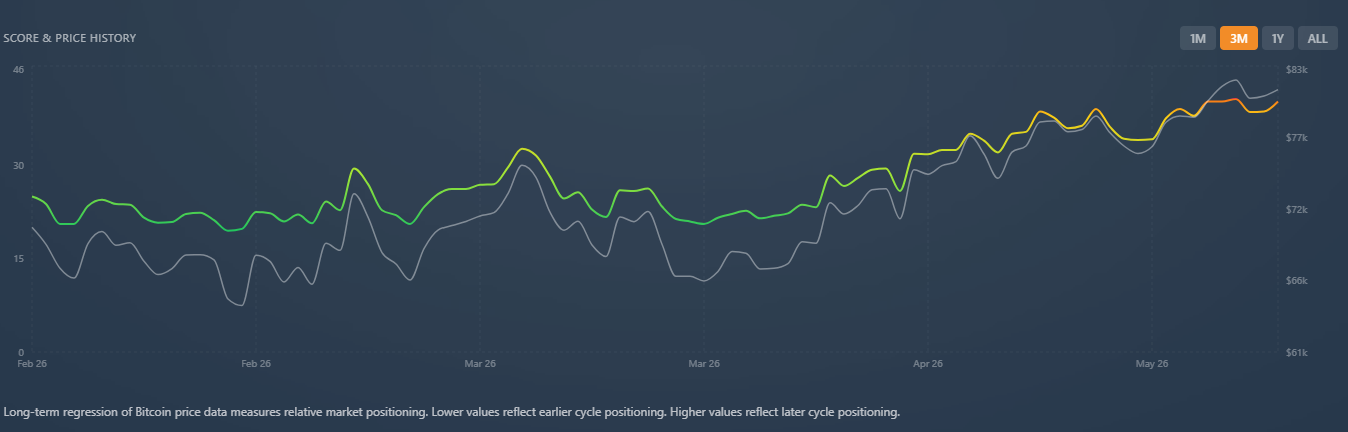
The Score’s been climbing for 12 weeks. Bottom was 18.9 on Feb 6 with BTC at $62,854. We’ve added 21 points to the Score over 90 days. Today’s reading is 40.3.
That just nudged us into the mid-range zone (40-60).
For context, 40.3 sits at the 24th percentile of all-time Score readings going back to 2011. BTC has been below this level only 24% of the time in its entire history. We’re well clear of deep value, which we left in early March. Not in danger territory either, that doesn’t kick in until 60.
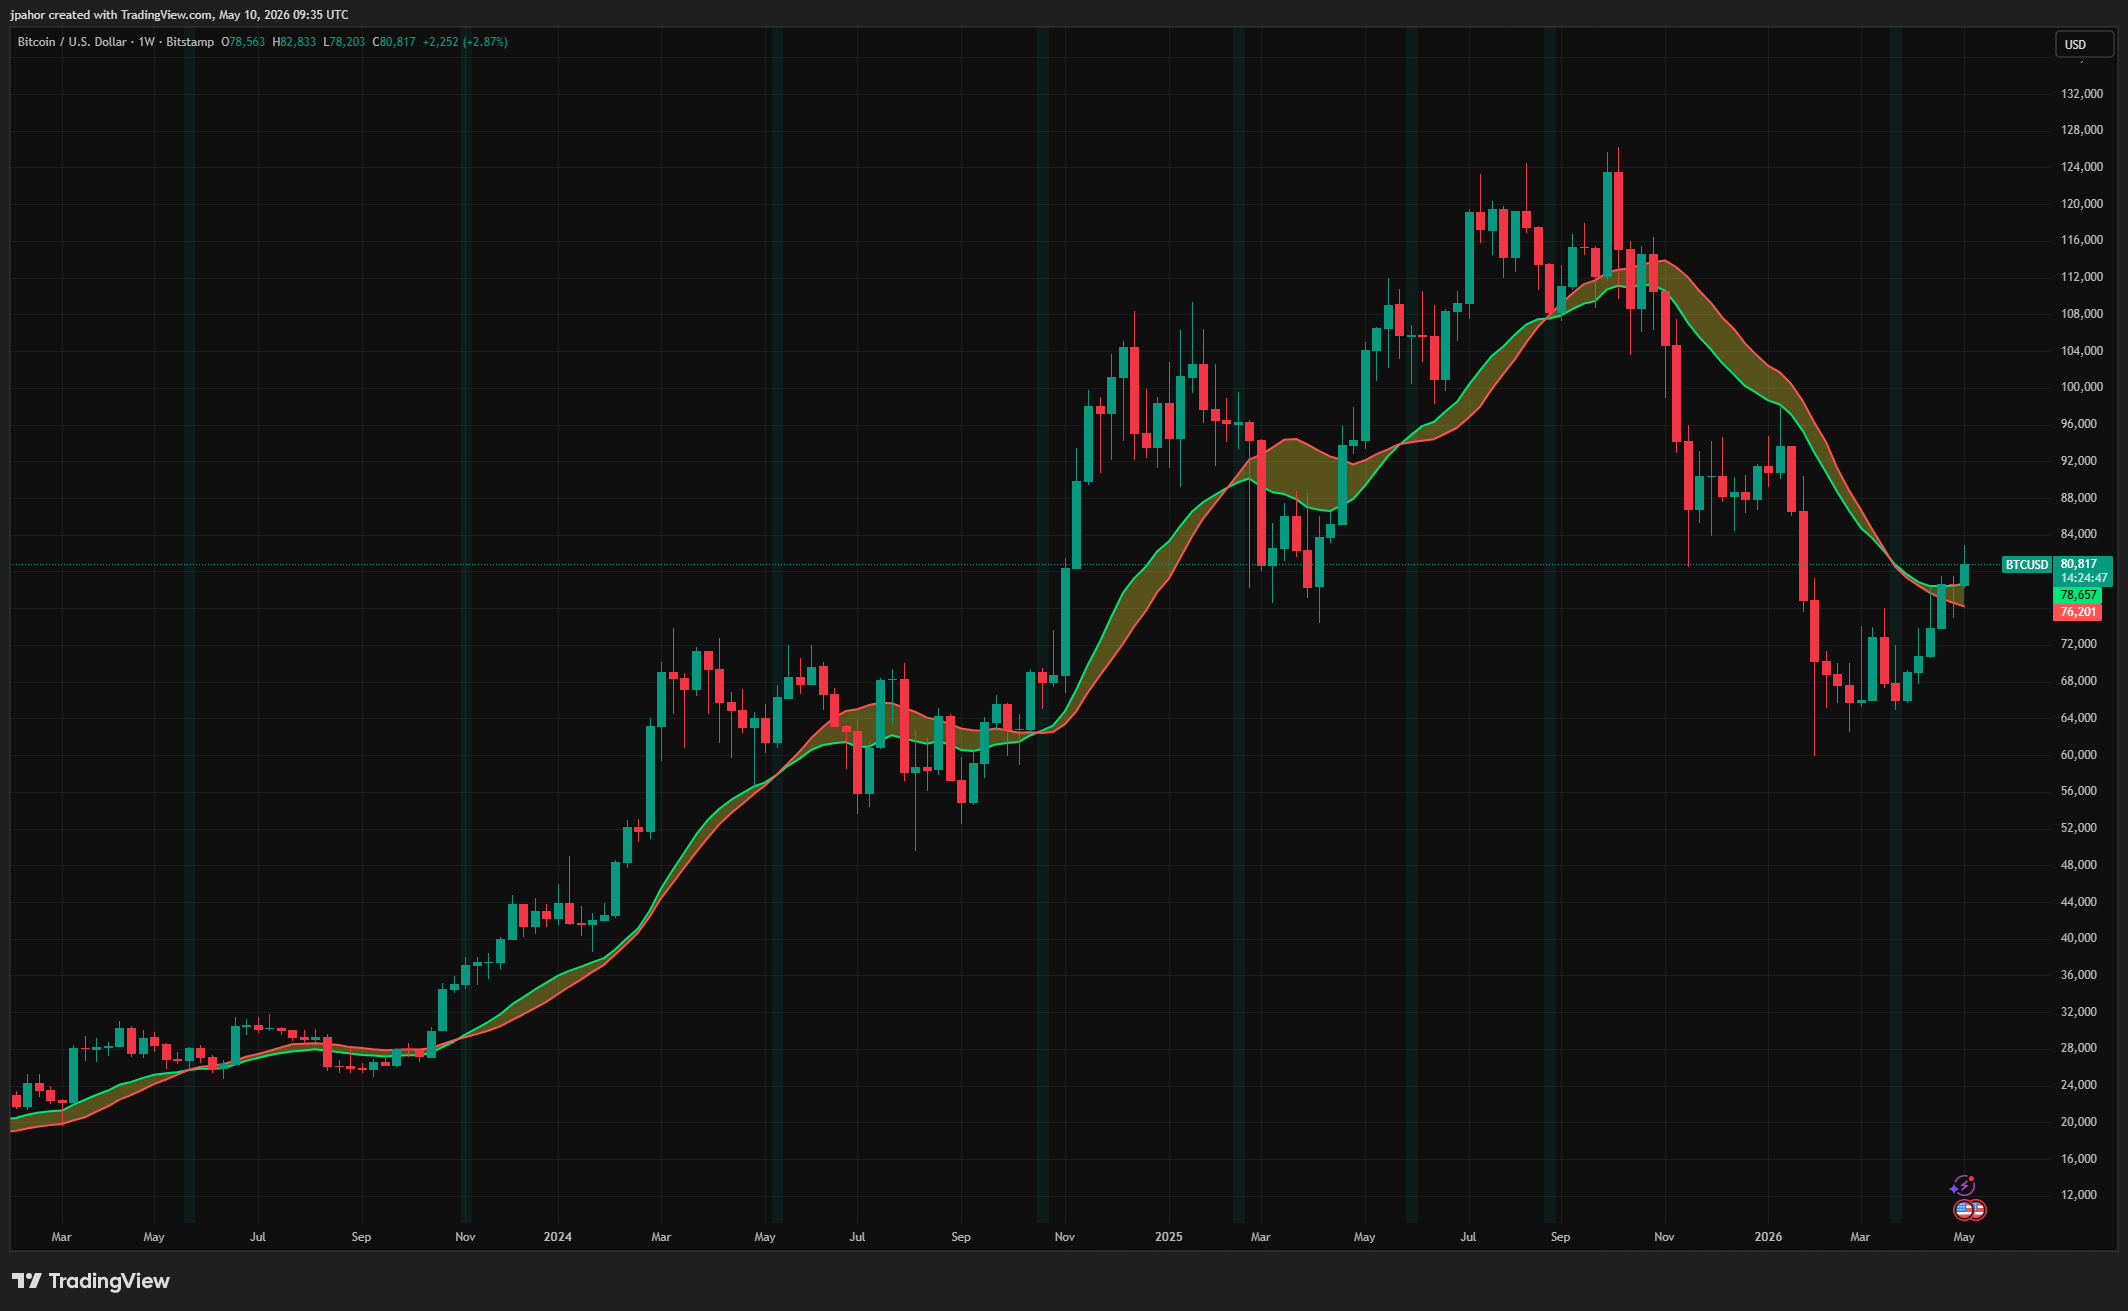
But we just stepped over a threshold that matters in the framework.
Here’s why. Every previous bear market had a counter-trend rally that pulled the Score off the lows, then failed. The 2022 mid-bear rally pulled the Score from 18 to 35. The 2018 rally pulled it from 50 to 69. The 2014 rally pulled it from 59 to 62.
Today’s signature, 19 to 41, most closely matches 2022.
That’s not a prediction. It’s a pattern.
The One Thing That Matters
Bear markets don’t go straight down. They have rallies that feel like recoveries. Money piles in. Headlines turn. People who were terrified at the lows convince themselves the worst is behind them. And then price rolls over and goes lower.
It’s happened three times in BTC’s history.
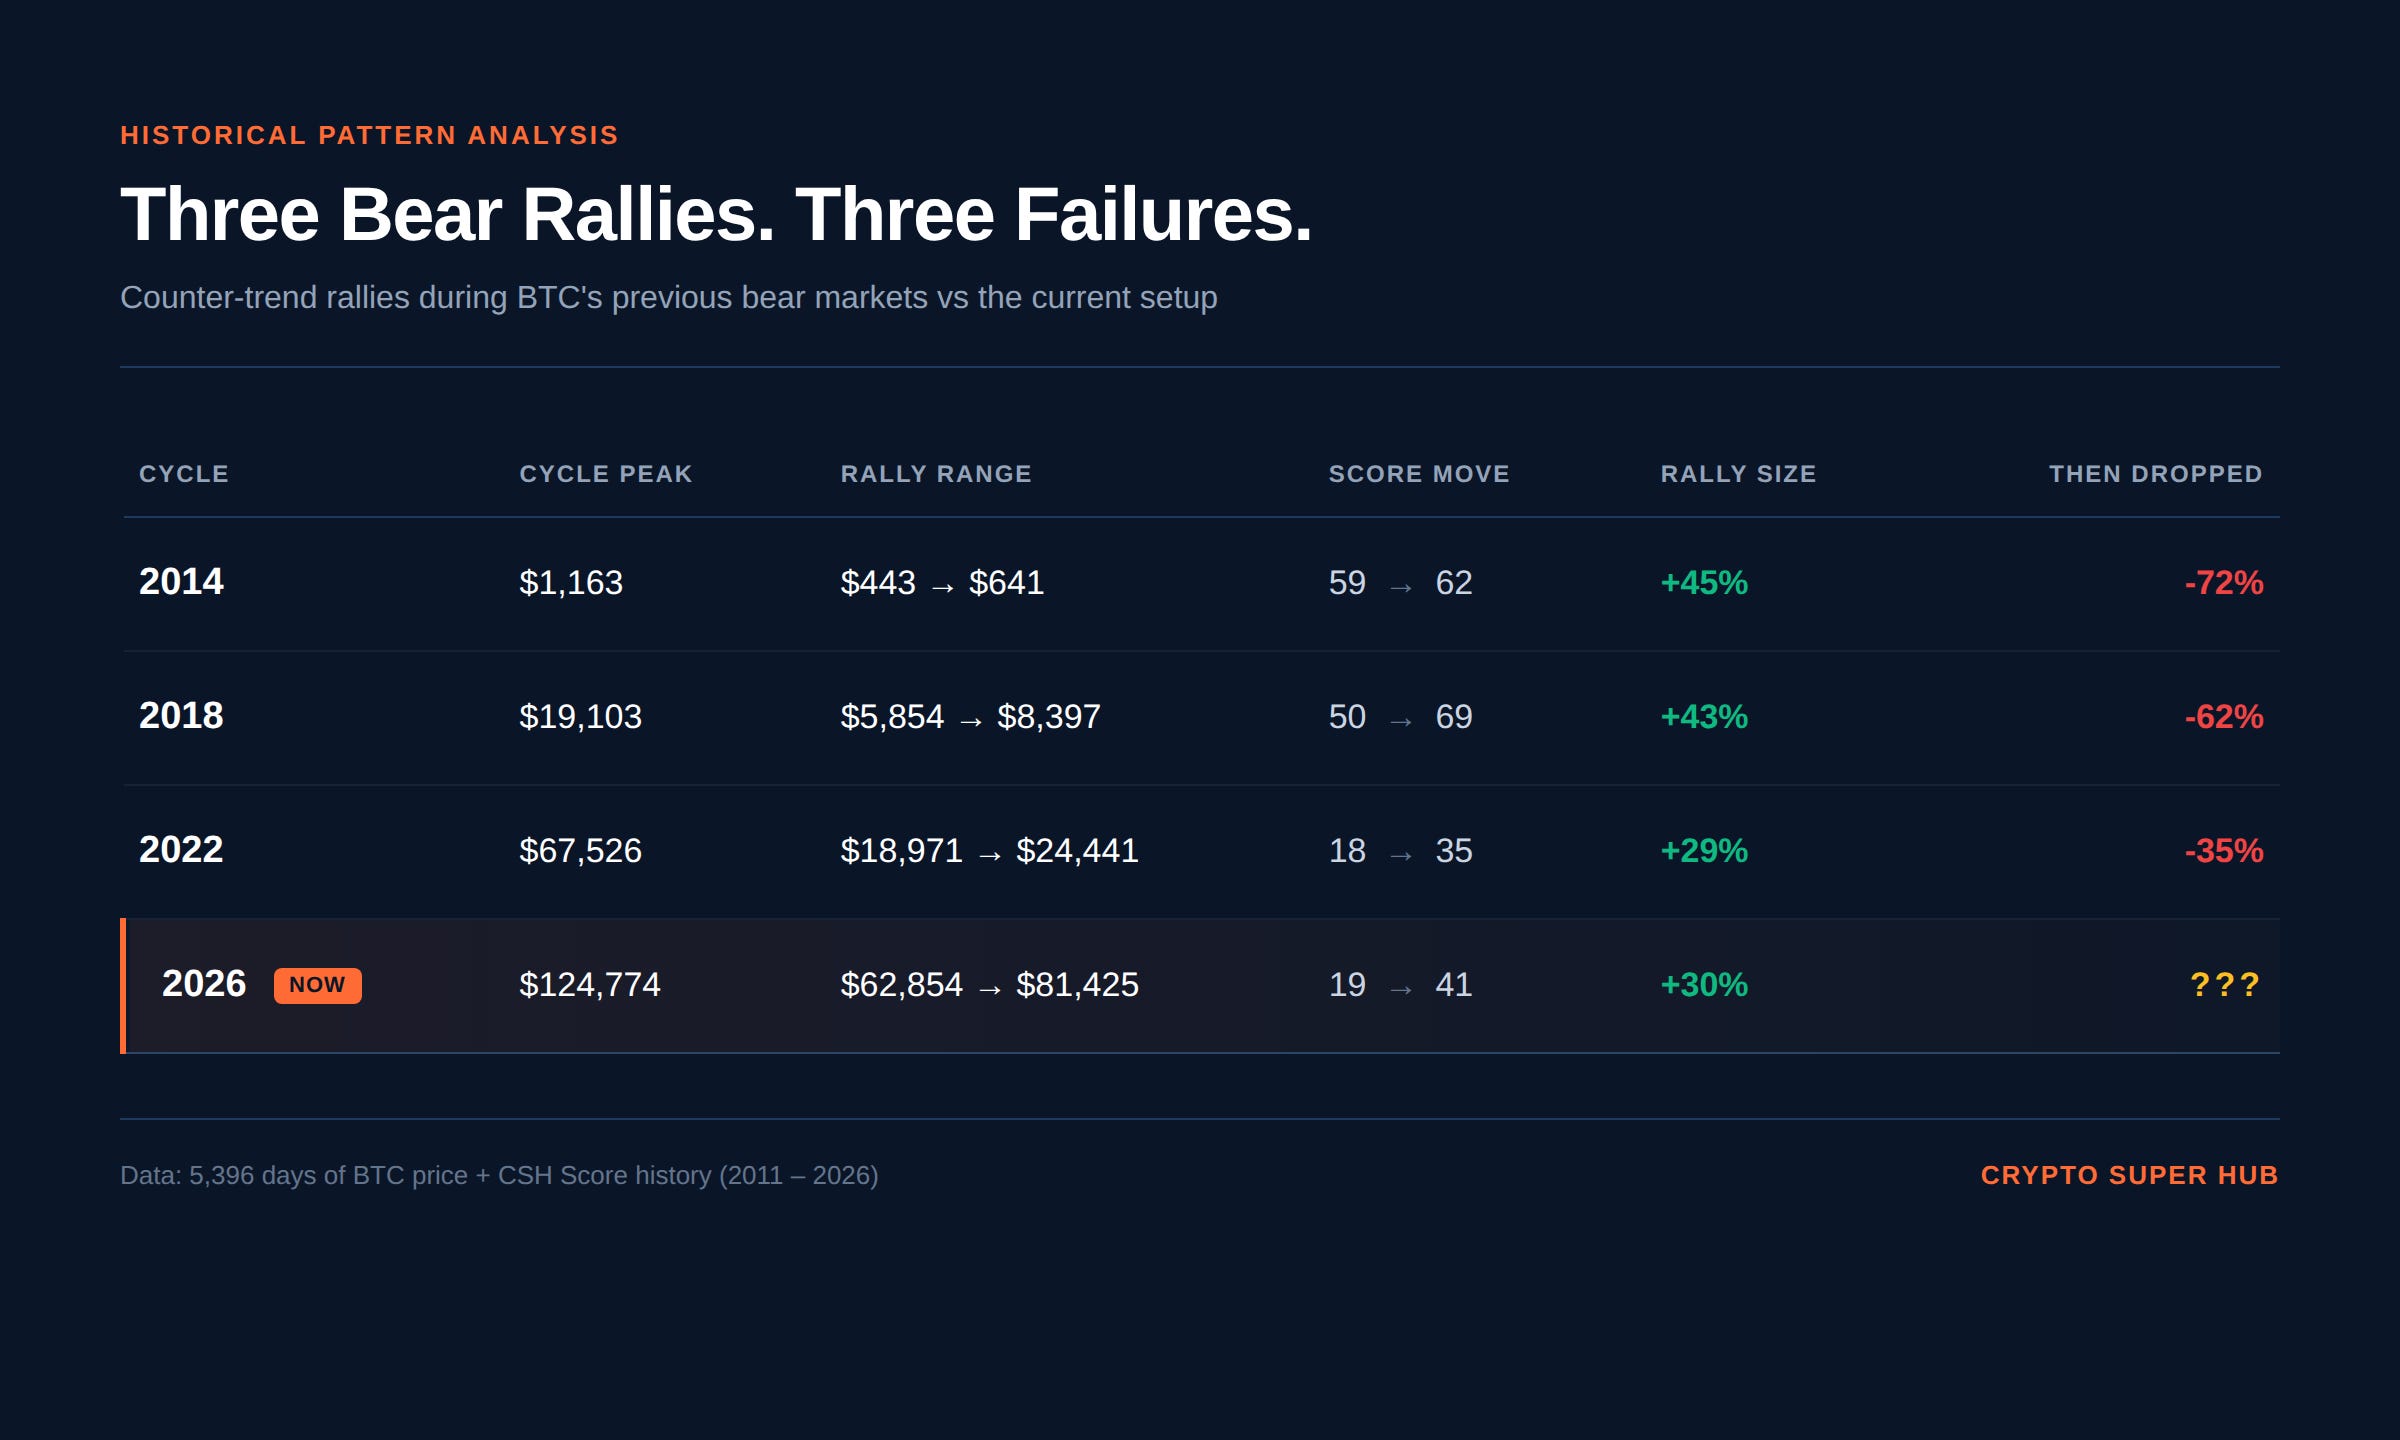
Look at 2022. BTC bottomed in June at $19K with the Score at 18. Over the next two months it rallied 29% to $24K and the Score climbed to 35. The mood shifted. Newsletters went bullish. Anyone who’d been waiting “for confirmation” stepped in. Then FTX collapsed and BTC dropped another 35% to $15.7K. The actual bottom came in November.
The 2018 rally was even spookier looking back. BTC bottomed at $5,854 in late June 2018, rallied 43% to $8,397 by late July, then dropped 62% to $3,212 by December.
Now move the decimal one place. $58,540 bottom. $84,000 rally peak. We bottomed at $62,854. Rally peak so far is $81,425. Within a few percent of an exact 10x replay. Are we living in a simulation? Probably not. But the rhyme is loud.
Three cycles, same script. Different magnitudes, same shape. Rally hard enough to convince people it’s over. Then go lower.
Now look at where we are. BTC bottomed in February at $63K with the Score at 19. We’ve rallied 30% to $80K and the Score is at 40. We’re 7 months after the cycle peak. The signature most closely matches 2022.
So what do you do?
The wrong question is “is this rally real?” Nobody knows. You don’t know. I don’t know. The right question is: what rules are you going to use?
Two investors. Same starting capital. Same monthly cadence. Different rules.
Investor A buys more when price rises off the lows. The rally feels like proof. Position size scales with confidence. He looks like the customers I described in the opening.
Investor B sizes by Score. Under 25 means triple normal DCA. 25 to 40 means standard. 40 to 60 means half. Above 60, pause.
Same money in. Different timing.
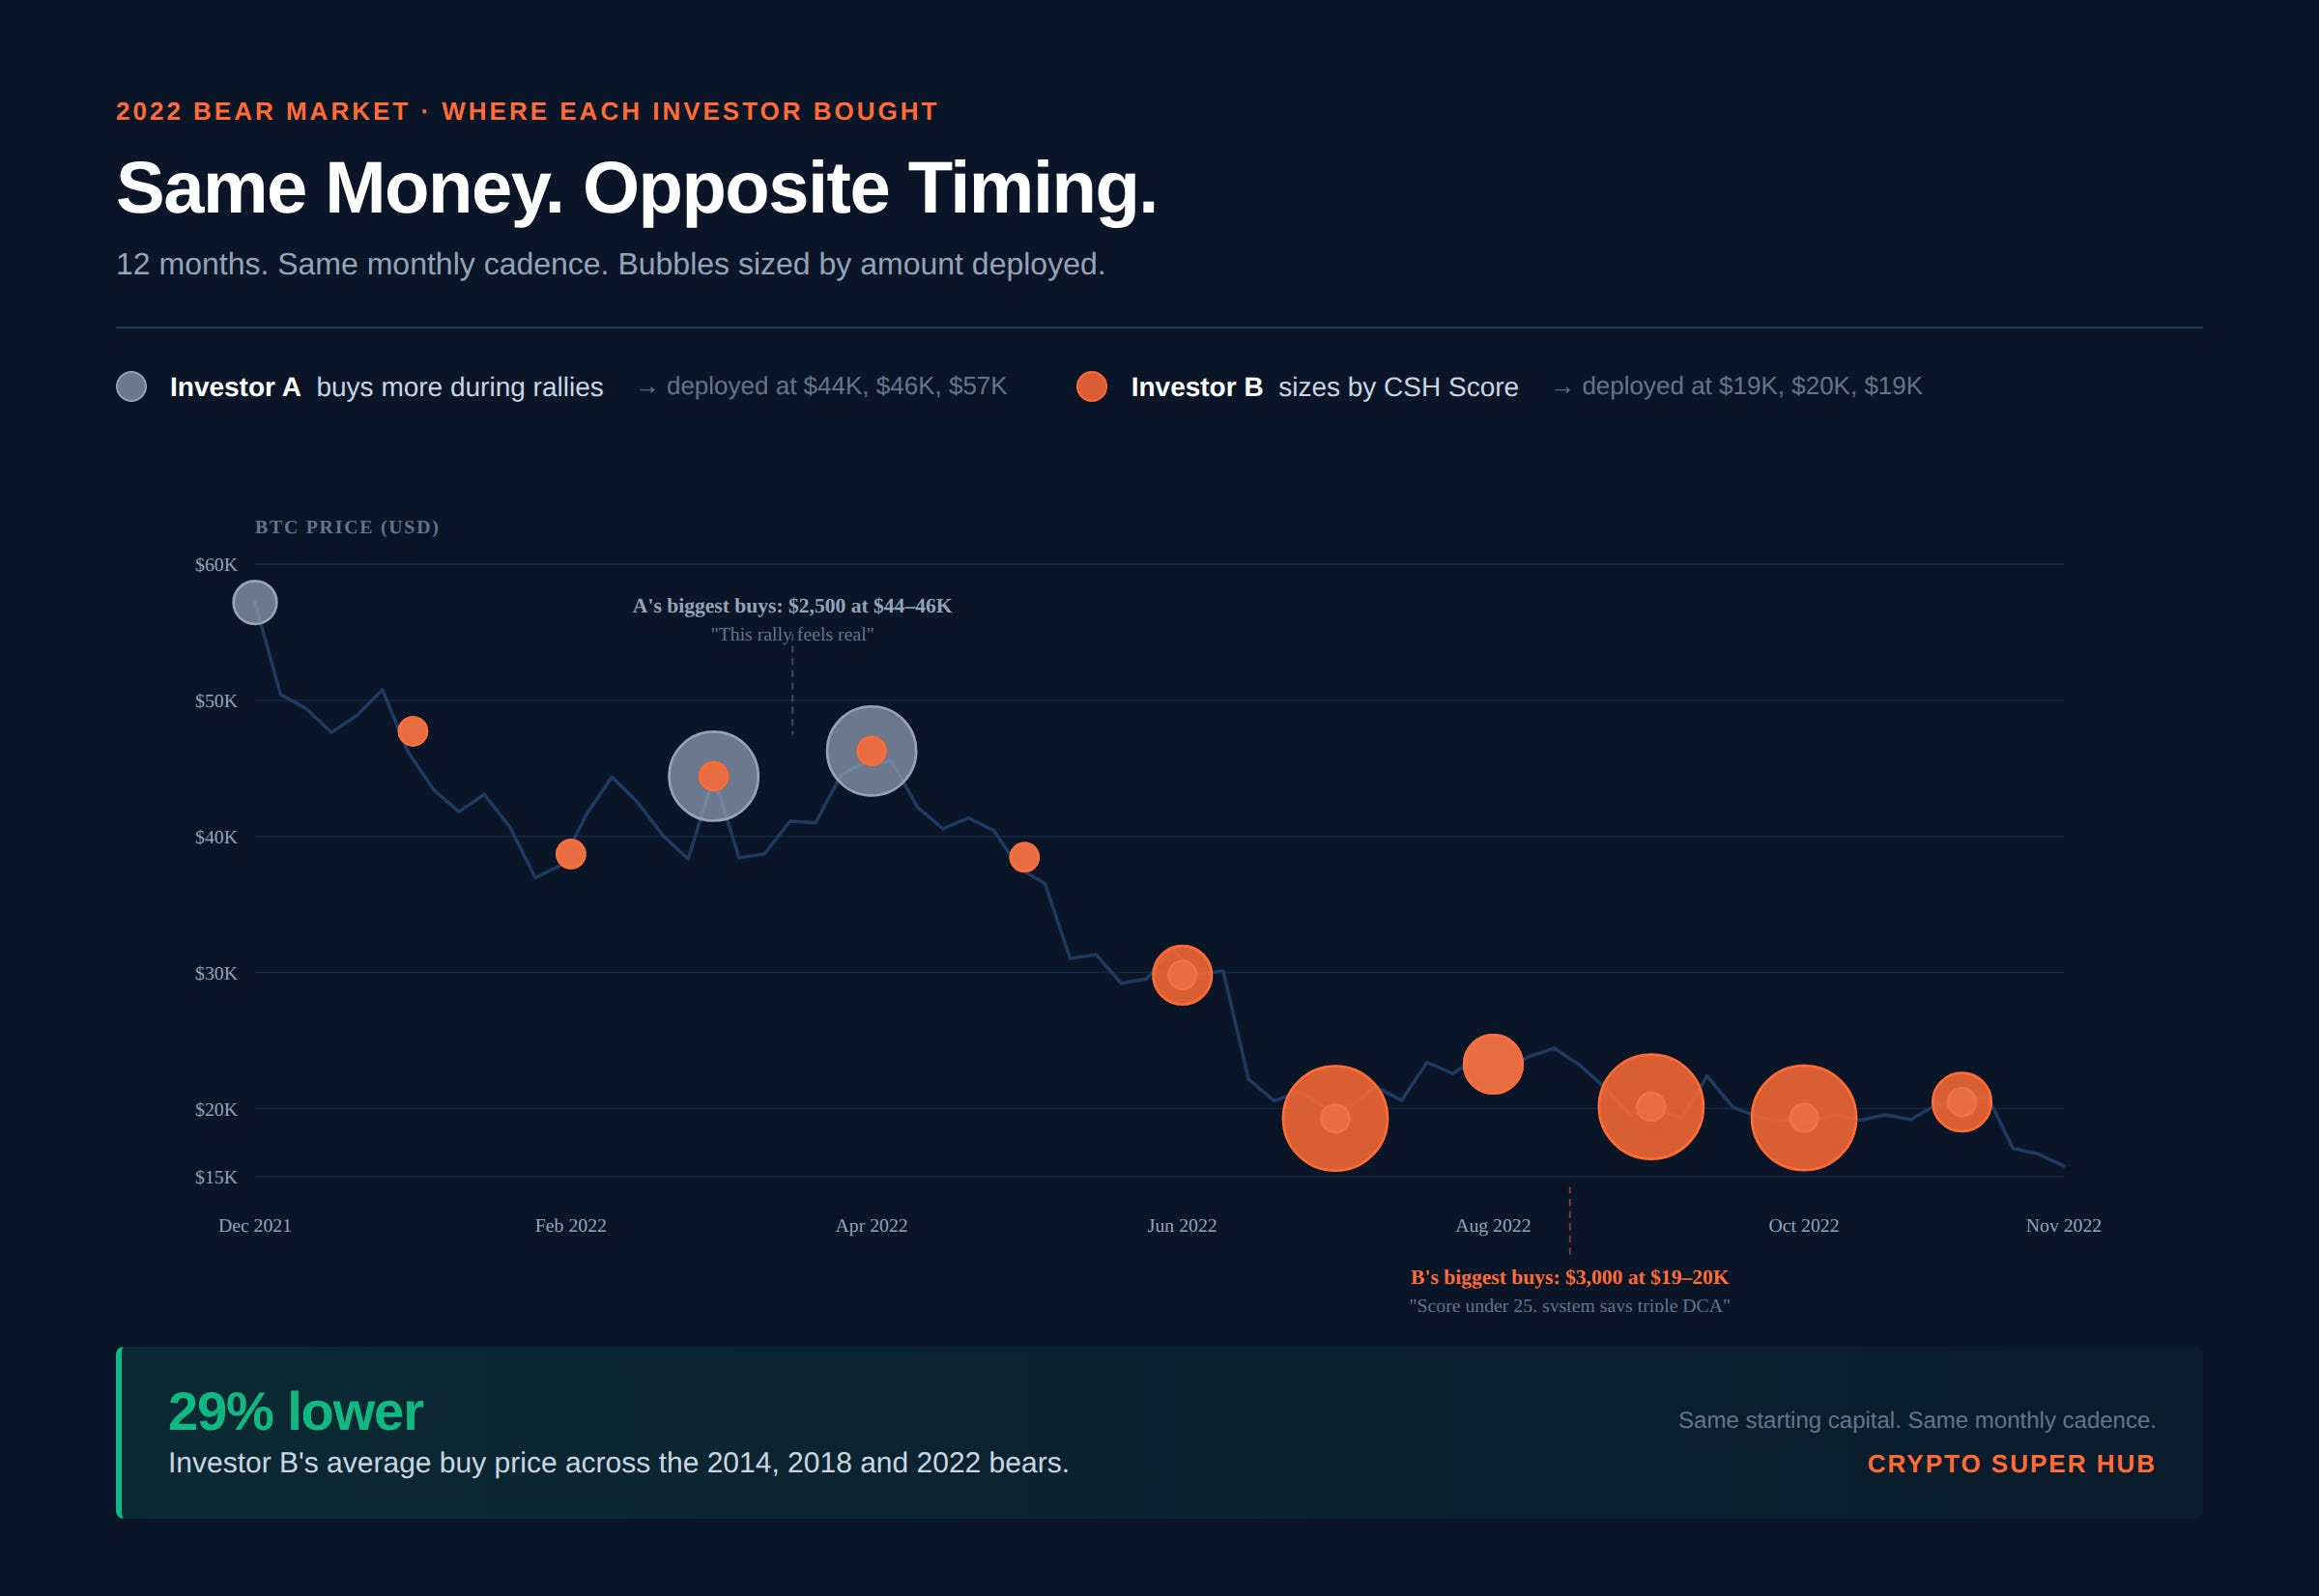
Look at where the money landed during the 2022 bear. Investor A’s biggest buys went in at $44K and $46K, when the rally felt strongest. Investor B’s biggest buys went in at $19K and $20K, when the Score said deep value.
Same instinct, opposite trigger. A trusted the rally. B trusted the rule.
Across all three bears, Investor B’s average buy price was 29% lower than Investor A’s. Held to the next cycle peak, Investor B’s returns beat Investor A by 175 to 1,630 percentage points.
The system doesn’t tell you whether this rally is real. It tells you how to size into it. That’s the only decision that matters.
Jake’s Workbench
Here’s what I’m doing personally with the Score at 40.
I’ve stopped DCAing.
Not selling. Not changing the long-term thesis. Just paused the buying. Score at 40 is in the mid-range zone. My rule says pause.
Next trigger is Score back below 30. If we drop into deep value territory again, I resume aggressive DCA. If the Score keeps climbing through 50 instead, I stay paused and let what I already have do the work.
That’s the framework running. No drama. No FOMO into a rally that might not hold.
The Plan Builder we shipped last month codifies exactly this. Adaptive scaling does what Investor B did in the backtest. Bigger entries at low Score, smaller entries as Score climbs. Set it once, the system handles the rest.
Honest reason I built it this way: I knew myself well enough to know I’d FOMO into rallies if I had to make every call manually. The system is the guardrail. You can build yours here.
Quick Hits
BlackRock’s IBIT crossed 812,000 BTC. That’s about 3.8% of total Bitcoin supply held by a single ETF. Spot ETFs added $1.7B over five straight days last week with IBIT leading. So what: structural buyers absorb selling pressure from coins underwater between $80K and $120K. Doesn’t change the bear-or-bull question. It does mean the floor is firmer than the 2022 cycle had.
Exchange reserves hit a 7-year low. Whales net-bought 270K BTC over the last 30 days. So what: less BTC sitting on exchanges ready to sell. Even if the rally fails, the floor is firmer than any prior cycle bottom had.
Glassnode flagged BTC crossing two key cost basis levels. True Market Mean and Short-Term Holder cost basis. So what: when price holds above both, most active investors sit in profit. Normally a constructive setup. Worth watching whether it sustains or rejects in the coming week.
Powell’s term as Fed Chair ends May 15. That’s this Friday. Kevin Warsh is the leading candidate to replace him. Hawkish on rates, but reportedly more open to financial innovation and crypto deregulation. The next FOMC isn’t until June 16-17.
The Week Ahead
Powell’s last day: Friday May 15. Watch the Warsh confirmation timeline and any signals on rate cut path. Markets tend to overreact to Fed transitions in the first 48 hours.
$85K is the level. Multiple desks flag it as the next major resistance. A clean break and hold above $85K would invalidate the 2022 parallel and start to look more like a real recovery. Failure to break extends the bear-rally pattern.
The Score’s path matters more than price. We just stepped into the mid-range zone at 40. Watch whether 50 holds as resistance. Every previous failed rally showed the Score climbing through the 40s, hitting a wall, then rolling over. If it punches through 55 with conviction, the bear-rally thesis weakens.
The Close
Three bears. Three rallies that fooled people. One question that’s still open.
The data doesn’t tell you what’s going to happen. It tells you how to be positioned for either outcome. Investor B didn’t need to know in 2022 whether the August rally would hold. The system handled it.
Genuine question: are you DCA-ing through this rally, or sitting on the sidelines waiting for confirmation? Reply with 1 or 2.
See you next week.
Jake
2 waiting for lower but not now convinced its coming as all of x is waiting for it