

Crypto Super Hub — Weekly Market Intelligence | Mar 22, 2026
BTC dropped from $74K to $71K within hours of the FOMC announcement on Wednesday.
Last week’s newsletter flagged the exact pattern: BTC has dropped after seven of eight FOMC meetings since early 2025. The January hold triggered a 7.3% sell-off within 48 hours. The March hold just triggered a 4.3% drop. Same setup, same result. The system called it.
But here’s what most people missed while watching BTC bounce. The real damage this week wasn’t in Bitcoin. It was in everything else. ETH fell harder. SOL fell harder. The altcoin market cap relative to BTC dropped again. And nobody seems to be talking about why.
That’s what I want to focus on this week. Not the FOMC. Not oil. Not the headlines. The structural case for why your altcoins are in a worse position than you probably think, and what the data says about when that actually changes.
CSH Risk Dashboard
CSH Score: 25.7 / 100 | Accumulation Zone | Direction: Down (-1.2 points, -4.5% over 7 days)
Quick callback. Last week the score sat at 26.9 after rallying from 22. I said the bounce had the feel of a bear market rally, not a bottom. BTC hit $74K before the FOMC, then sold off to $70.9K. The score dropped back to 25.7. We’re right back where we were.
That $67K-to-$74K rally and pullback is exactly what bear market rallies look like. Sharp, fast, driven by short squeezes and positioning, then they fade. The CSH Score didn’t break above 30. That’s the level that’s historically separated “still in the bear” from “something’s changing.” Until it does, accumulation territory remains the read.
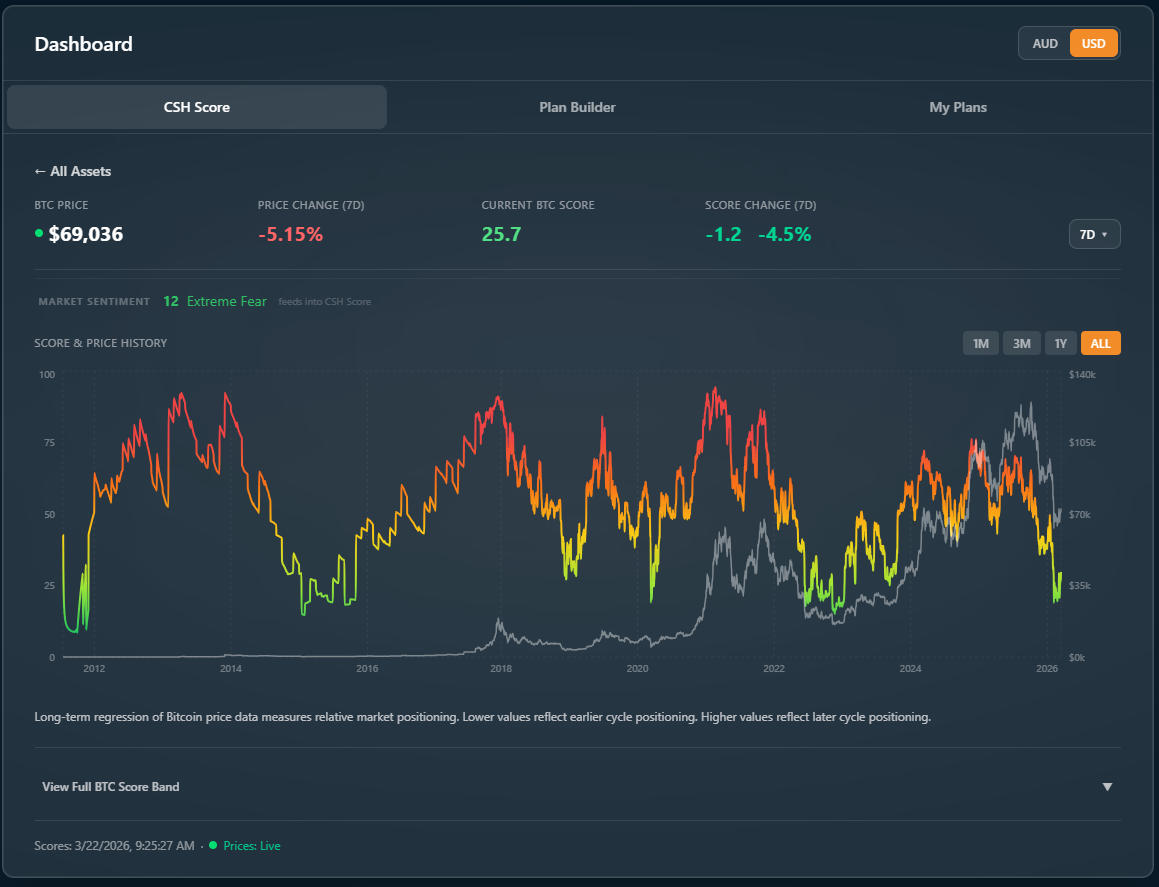
Key Risk Indicators:
Market Sentiment: 12 (Extreme Fear. Briefly rallied to 28 mid-week during the push to $74K, then collapsed right back. That tells you everything about the strength of this bounce)
BTC Price: ~$68,994 (7d: -5.29%)
BTC Dominance: ~58.8% (and rising. Important for what comes next)
Total Crypto Market Cap: ~$2.49T
ETH/BTC Ratio: 0.0303 (continuing to grind lower)
Jake’s Read: Market Sentiment at 12. It briefly hit 28 mid-week when BTC touched $74K, then collapsed straight back to Extreme Fear once the FOMC sell-off hit. A sentiment reading that can’t hold above 25 even during a 10% rally tells you the underlying conviction isn’t there. BTC has now given back most of that rally, sitting under $69K as I write this. The score at 25.7 tells me we’re in the same window we’ve been in for eight weeks. Accumulation territory. The plan should be running. But while BTC has held relatively well through the FOMC chaos, look at what’s happening beneath the surface. BTC dominance at 58.8% is back near its 2025 highs. ETH/BTC at 0.0303 is near cycle lows. Capital is consolidating into BTC and leaving everything else behind.
That’s not random. It’s a pattern that plays out every single bear market. And it’s what this week’s deep dive is about.
The Altcoin Trap
A lot of people are sitting on altcoin bags right now wondering when the bounce comes. I think they’re asking the wrong question.
The question isn’t when alts bounce. It’s whether this is even the right part of the cycle to be holding them at all.
The macro case is ugly.
The FOMC raised its 2026 inflation forecast to 2.7%. Seven of nineteen committee members now expect zero rate cuts this year. Powell said he won’t cut until inflation makes clear progress. Rate relief has been pushed back to December at the earliest, with some traders pricing nothing until 2027.
Oil is still above $100. The S&P 500 has been weakening against gold for months. Investors are rotating from risk to defense. And the dollar index is above 100, which historically tightens financial conditions for speculative assets globally.
That’s the backdrop. Now here’s why alts specifically are the worst place to be in this environment.
Risk leaves the system in stages.
Independent macro researcher Benjamin Cowen published a framework this month that maps almost exactly onto what the CSH Score has been showing. He calls it a “risk cascade.” It works like this: when liquidity tightens, the most speculative assets bleed first. Then the pain moves up the quality ladder.
In crypto, that means altcoins weaken first. Then Bitcoin. Then, if it gets bad enough, it spills into equities and eventually the real economy. We’re watching this play out in real time. Alts started bleeding against BTC back in 2022. BTC peaked in Q4 2025. Equities are now weakening against gold. The cascade is progressing exactly as the framework predicts.
The critical point: alts are Stage 2 in a five-stage process. They were the first to weaken and they’ll be the last to recover. Capital doesn’t flow back down the quality ladder until liquidity gets genuinely loose again. And liquidity isn’t loose. The Fed just confirmed that.
The TOTAL3/BTC chart tells the whole story.
I flagged this ratio back in Issue #1. At the time it was sitting at 0.39, trending down since 2021. Five weeks later, it’s at 0.38 and still grinding lower.
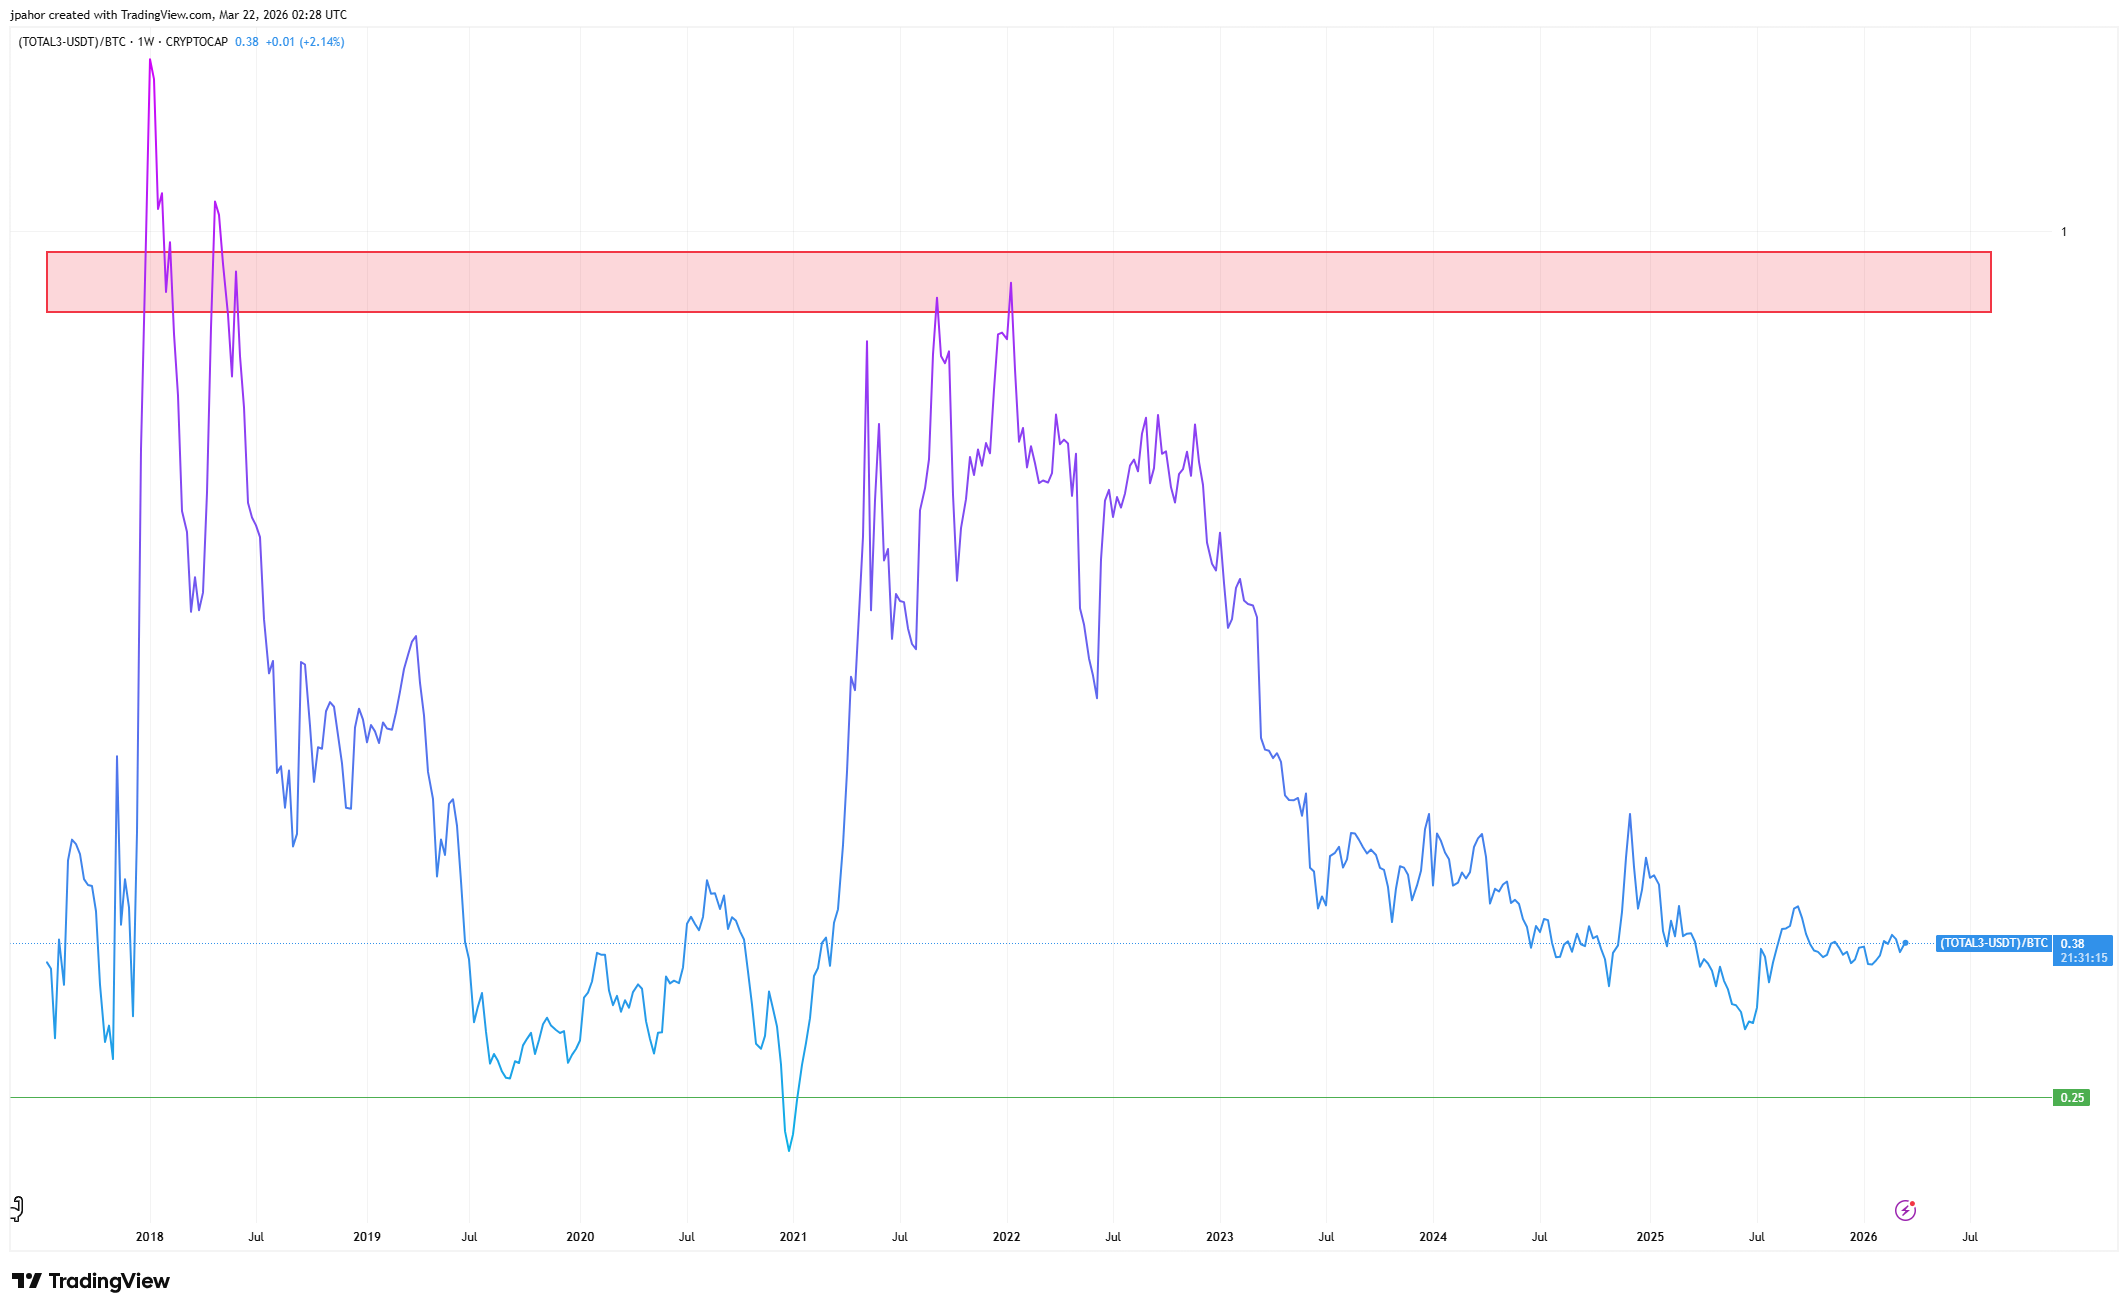
For anyone not familiar: TOTAL3 is the total altcoin market cap excluding BTC, ETH, and stablecoins. Dividing it by BTC gives you a clean measure of whether alts are outperforming or underperforming Bitcoin.
The historical pattern:
The ratio peaks around 1.0 during euphoric alt seasons (the red zone on the chart)
In previous cycles, alts didn’t bottom against BTC until this ratio hit approximately 0.25
It often stayed at those lows for over a year before recovering
Right now we’re at 0.38 and trending down
If the pattern holds, altcoins could still see another 30%+ downside relative to BTC before this is over. That’s not a price prediction. That’s what the ratio has done in every prior cycle.
BTC dominance at 58.8% confirms this from the other side. It peaked around 64-65% in mid-2025 and has been climbing back toward those levels since BTC topped. The trend is clear: capital consolidates into Bitcoin when conditions tighten. The speculative excess at the edges of crypto was already being flushed out before BTC itself topped. The people who buy altcoins, retail speculators chasing the next 100x, have been quietly leaving the market for years. Without them, there’s no demand engine for an alt recovery.
So when does it end?
Two conditions need to flip. First, the CSH Score needs to break back above 30 and stay there. That’s the signal that the broader risk environment is shifting. We haven’t seen it yet. Second, the TOTAL3/BTC ratio needs to stop making lower lows. When both of those things happen together, that’s the window to start thinking about rotating some BTC exposure into alts.
In 2022, alts didn’t bottom against BTC until months after BTC bottomed. In 2018, same pattern. BTC leads, alts follow with a lag. The system doesn’t say avoid alts. It says not yet.
The rotation into alts will come. But the data says we’re months away from that, not weeks.
Jake’s Workbench
Skool Community: Week Two
Tom and I have been in the Skool community every day this week. The first two course modules are live. The three-step CSH methodology, plain English, step by step.
The most common question people are asking: “I have BTC and a bunch of alts. What do I do?” Which is basically what this entire newsletter is about. The Plan Builder is designed for exactly this scenario. You set your accumulation ranges, your target allocations, and the system tells you what to do at each score level. A few members have already shared their setups.
If you haven’t joined yet, it’s free. No paid tier. No upsell.
Quick Hits
FOMC held rates at 3.50-3.75%, dot plot points to one cut (maybe). Seven of nineteen members now expect zero cuts in 2026, up from six in December. Powell pushed back on the “stagflation” label but acknowledged “tension between goals.” Markets pushed the first potential cut back to December. BTC dropped 4.3% within hours, continuing the pattern of selling off after 8 of 9 FOMC meetings. So what: No rate relief coming. The system doesn’t wait for rate cuts. It reads the score.
CoinDesk published analysis backing the same BTC pattern we covered in Issue #6. Their March 20 piece noted that current BTC price action mirrors the November-January pattern that preceded the drop to $60K. The bear market rally thesis is getting broader recognition. So what: The data hasn’t changed. Until the CSH Score breaks above 30, rallies are opportunities to stick to the plan, not to chase.
ETF inflows hit $767M in the five days before FOMC, then BTC dumped anyway. $199M flowed in on March 17 alone. But inflows didn’t prevent the sell-the-news drop. Post-FOMC low formed around $70.9K, roughly 48 hours after the announcement, consistent with the historical pattern. So what: If you’re DCA-ing, the post-FOMC window has historically been the best entry of the month. Next FOMC is May 6-7. Mark it.
The Week Ahead
Powell’s term situation is getting complicated. His term as Fed Chair is ending, with Kevin Warsh nominated as successor. But the confirmation is being held up by Senator Tillis over a DOJ probe into the Fed’s headquarters renovation. Powell said he hasn’t decided whether to stay on as a Governor after his Chair term ends. The May 6-7 FOMC could be one of his last meetings leading the committee. Any uncertainty around Fed leadership adds volatility.
March CPI drops mid-April, and it’ll be the first to capture the oil shock. February’s print came in at 2.4%, matching expectations. But that data was collected before oil surged above $100. Petrol prices are up 19% in two weeks. If March CPI comes in hot, rate cuts are dead for 2026. Watch this number closely.
BTC has lost the $70K level. After the FOMC dip to $70.9K mid-week, BTC continued sliding through the weekend and is now sitting under $69K. The $65K-$70K range is the next support zone. A bounce back above $70K and hold would suggest the sell-off is exhausting. A break below $65K opens the door to the $60K retest we’ve been discussing since Issue #6. CSH Score at 25.7 says accumulation territory either way.
The Close
Every four years, the CSH Score drops into the 20s. Every time it has, the people who accumulated BTC, not alts, came out the other side with the biggest gains.
We’re eight weeks into that window. The data says be patient, be positioned, and be in the right asset.
See you next week.
— Jake
What’s your biggest altcoin position right now? Reply with the ticker. I’ll share what the CSH score says about it next week.
great read. the risk cascade framework is the most useful way to think about where we are right now.