

Right now, crypto sentiment is about as low as I’ve seen it. Twitter is doom scrolling. The “crypto is dead” headlines are back. Your mates who bought the top in October have gone quiet.
And honestly? This is exactly the setup I’ve been waiting for.
Not because I enjoy watching portfolios bleed, but because every major wealth-building opportunity in crypto has started in moments that felt exactly like this one. The question isn’t whether the opportunity is real. It’s whether you have a framework to act on it.
Let me show you what I’m seeing.
Where We Are Right Now
BTC stabilised this week after its sharp drop to $60k on February 6th. The panic selling has cooled, but the fear hasn’t. Good. That’s how bottoms start forming. Slowly, painfully, while most people look the other way.
Here’s where things get interesting. The risk metric I track, which measures where an asset sits historically based on price, on-chain data, and a basket of key indicators, is flashing levels we rarely see.
Current Risk Levels (February 16, 2026):
BTC: 0.315
ETH: 0.429
XRP: 0.443
BNB: 0.274
SOL: 0.334
LINK: 0.304
Here’s how to read this: a risk level between 0 and 0.3 historically signals discounted accumulation territory. Between 0.6 and 1.0, you’re in profit-taking and potential blow-off top territory.
BNB, LINK and SOL are already inside or approaching that lower band. BTC is knocking on the door. ETH and XRP, notably, are still sitting in the 0.4 range, which tells me they may have further to fall before they become truly compelling.
For context, here’s where BTC risk bottomed in previous cycles:
2018 bear market bottom: 0.1 risk, BTC at $3k
2022 bear market bottom: 0.133 risk, BTC at $19k
We’re not at those extreme levels yet. But we’re trending in the right direction, and that matters.
The Playbook: Where History Says We’re Headed
Let me take you through the cycle lens, because the pattern here is remarkably consistent.
Every BTC market cycle top since 2013 has occurred in Q4 of the post-halving year. Like clockwork:
Q4 2013
Q4 2017
Q4 2021
Q4 2025
The four-year cycle is intact. Now let’s look at what follows, because this is the part that gives me confidence.
Bear market durations from the cycle peak:
2014: 406 days, -85% drawdown
2018: 364 days, -83% drawdown
2022: 365 days, -77% drawdown
2026: ? days, -50% so far
Notice two things. First, the drawdowns are getting shallower each cycle. Diminishing pain to match diminishing returns. Second, bear markets consistently last roughly 12 months from the peak.
We’re already sitting at a 50% drawdown from the October 2025 top. If the diminishing-severity pattern holds, we may already be through the worst of it.
But the timing question is where it gets nuanced. I see two plausible scenarios.
Scenario 1: The 2019 Playbook (Faster Recovery)
There’s a case to be made that the October 2025 peak was more like the 2019 mid-cycle top than a traditional blow-off peak. Why?
No euphoric retail mania
BTC was the only asset that meaningfully performed (no real alt-season)
It felt more like a “QT-style” conservative bull market
If that’s the case, the following bear may be milder and shorter. In 2019-2020, excluding the COVID black swan in March 2020, BTC only saw a ~54% drop over about six months.
Under this scenario, BTC could find a bottom as early as June 2026.
Scenario 2: The 2018/2022 Playbook (Full Cycle Reset)
If this bear plays out like the traditional post-blow-off-top drawdowns of 2018 and 2022, we’re looking at roughly 12 months of downside from the October 2025 peak.
Under this scenario, BTC could find a bottom around October 2026.
What I’m Watching: Three Signals That Have Called Every Bottom
Rather than guessing, here are the specific indicators I’m tracking. These have historically marked the exact inflection points.
1. The 200-Week Moving Average Test
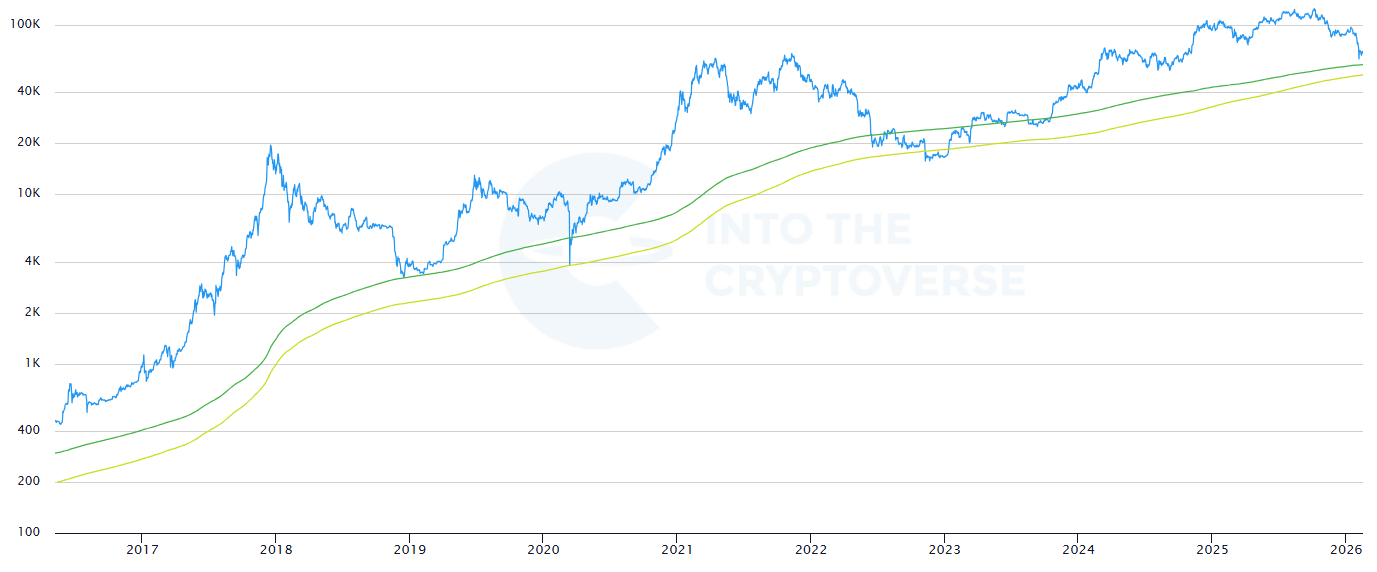
BTC has dropped below the 200-week moving average in every single bear market bottom. Historically, price finds support between the 200-week and 300-week MA. Look at the chart below. Every time the blue line (price) dips below the green line (200W MA), that’s where the bottom forms.
Right now, the 200-week MA sits at $58.3k and the 300-week is at $50.8k. We’re approaching the zone.
[Chart: BTC price vs 200-week and 300-week moving averages]
2. The Supply in Profit/Loss Crossover
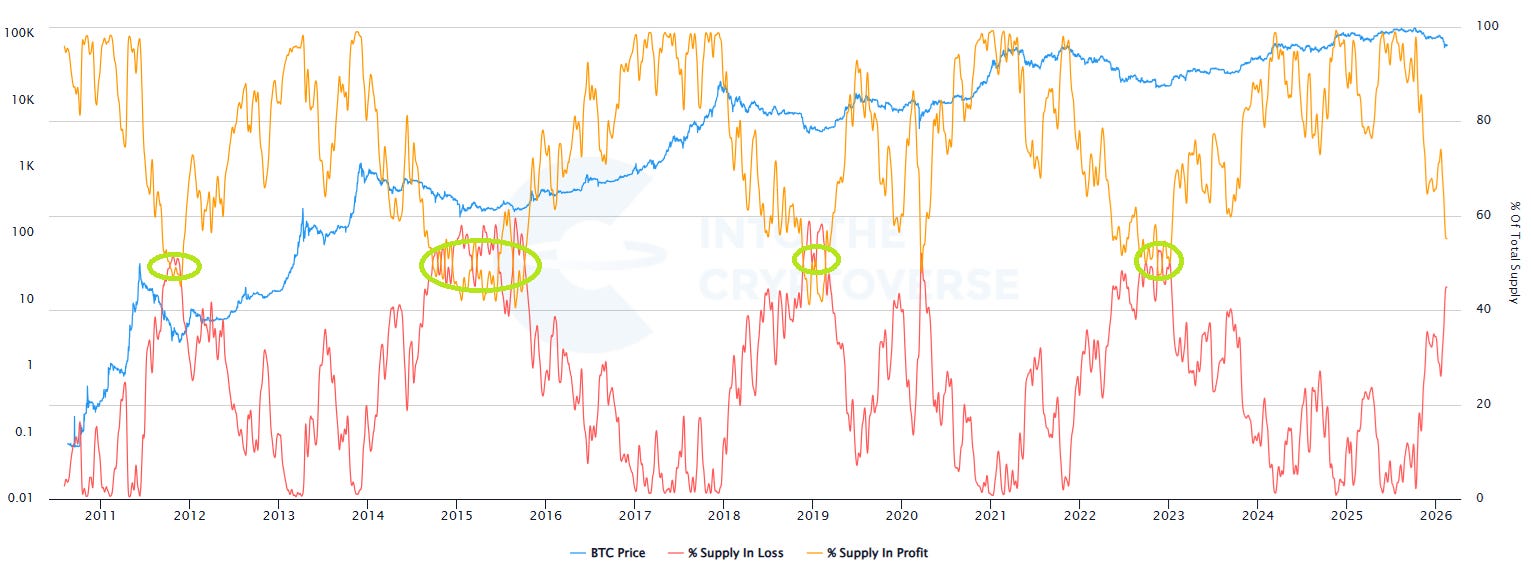
This one is beautifully simple. When the percentage of BTC supply in loss crosses above the percentage in profit, the cycle bottom is in. See the green circles on the chart below? Those are the crossover points in 2011, 2015, 2019, and 2022. Every single one marked the bottom.
We haven’t crossed yet, but the lines are converging. One to watch closely in the months ahead.
[Chart: BTC % Supply in Profit vs % Supply in Loss]
3. The Realised Price and Balanced Price Floor
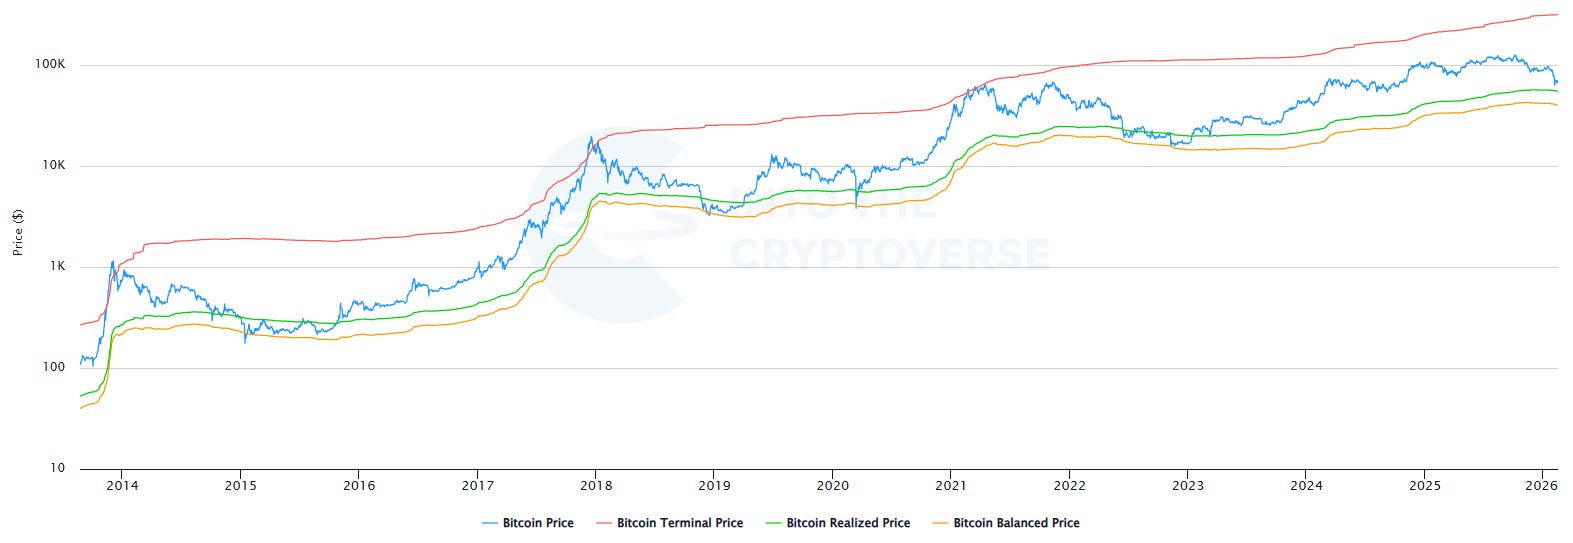
During bear markets, BTC tends to bottom when it drops below the realised price and bounces off the balanced price. In the chart below, watch the blue line (BTC price) relative to the green line (realised price) and the orange line (balanced price). In every previous bear market, price dipped below the green and found a floor near the orange.
Current levels:
Terminal price: $313k (top indicator, didn’t trigger in 2025, similar to 2019)
Realised price: $55k
Balanced price: $40k
[Chart: BTC price vs Terminal, Realised, and Balanced prices]
The synthesis: If history rhymes, BTC is likely heading for a bottom somewhere between $40k and $50k, arriving between May and October 2026.
What About Altcoins? The Uncomfortable Truth.
I know this isn’t what most people want to hear, but I think alts remain a risky bet right now.
During bear market years, altcoins have historically bled against BTC. It’s the same pattern every cycle: capital rotates into the largest, most liquid, and perceived “safest” asset.
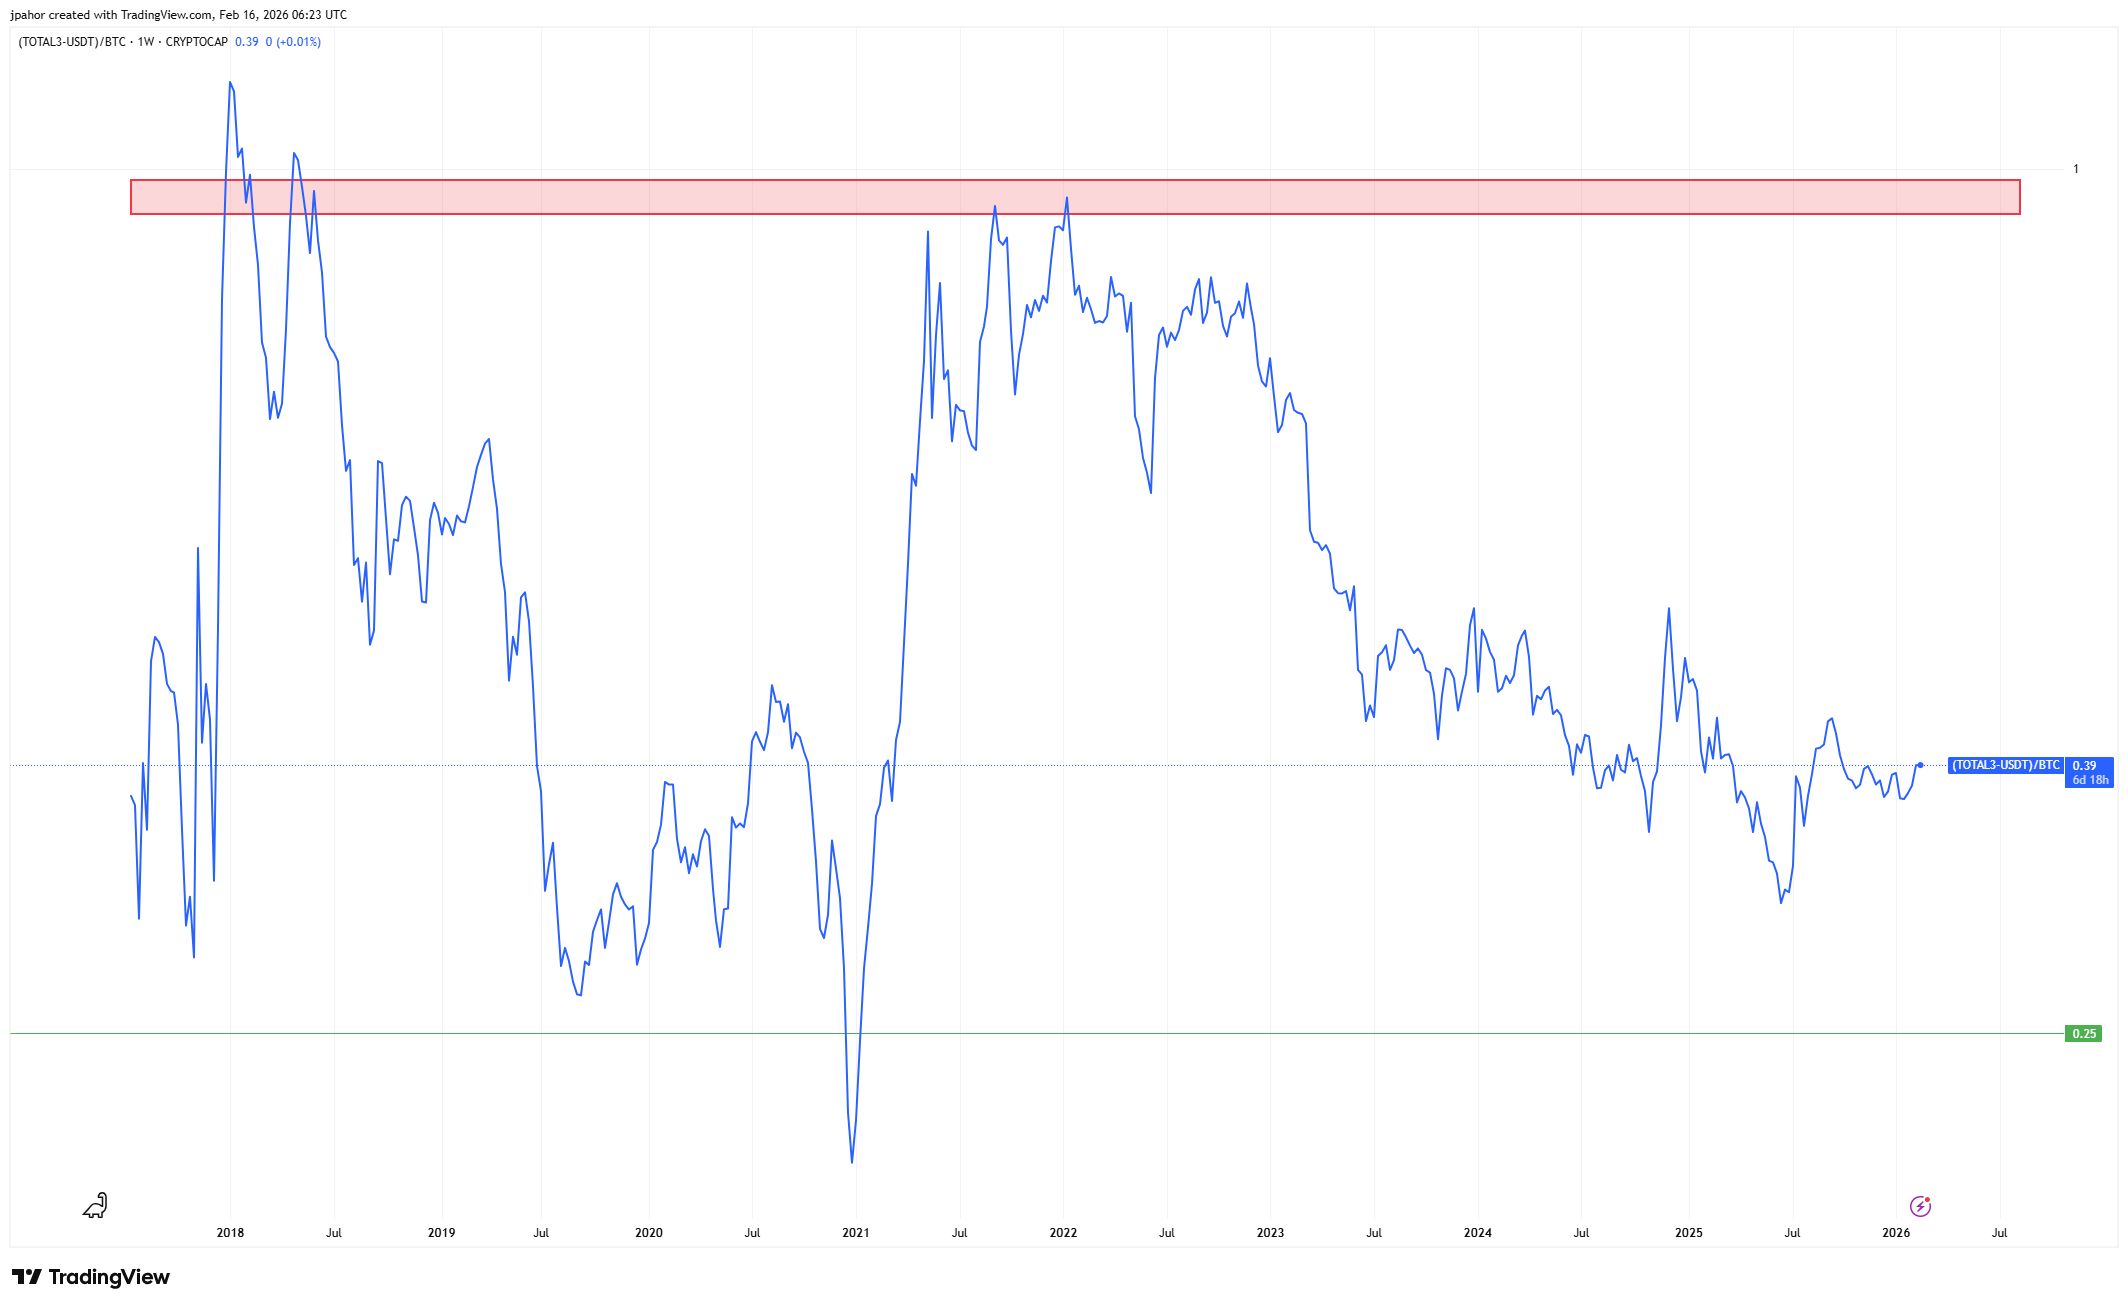
One chart I’m watching closely is TOTAL3 (total altcoin market cap excluding BTC, ETH and stablecoins) divided by BTC. This ratio measures whether alts are outperforming or underperforming Bitcoin over time.
Take a look at the chart below. The red zone at the top (around 1.0) is where alts peak relative to BTC during euphoric alt seasons. The green line at the bottom (0.25) is where alts have historically bottomed. Right now we’re sitting at 0.39 and trending down since 2021. The pattern is clear.
Here’s what this means:
Tops in this ratio occur when altcoin market cap approaches parity with BTC (the red zone)
In previous cycles, alts didn’t bottom on their BTC pairs until this ratio hit approximately 0.25, and it often stayed there for over a year
If we follow that pattern, altcoins could still see another 35%+ downside relative to BTC
[Chart: TOTAL3/BTC ratio with historical cycle markers]
The strategic play: Consider accumulating BTC during this phase. When monetary conditions ease and there’s strong evidence of alts bottoming against BTC on this ratio, you can rotate a portion of your BTC into altcoins. This approach keeps you exposed to the upside through BTC while protecting against further altcoin-specific downside.
The Bigger Picture: Why This Bear Market Is Different From Every One Before It
Now here’s the part that actually gets me out of bed in the morning.
While everyone is focused on price action, something fundamental is shifting beneath the surface. The AI revolution isn’t just coming. It’s accelerating. And its intersection with crypto isn’t a nice theory. It’s an inevitability.
Think about it. Autonomous AI agents aren’t going to:
Open bank accounts
Wait three days for settlement
Operate on a 9-to-5 schedule
They’re going to spin up wallets. Use stablecoins. Plug directly into DeFi protocols.
AI optimises for speed and permissionlessness. That’s literally what crypto infrastructure was built for.
Now scale that picture. Imagine billions of AI agents transacting 24/7 on decentralised rails. The biggest crypto adoption wave might not come from retail. It might come from machines.
The people building and accumulating during this bear market, especially at the intersection of AI and crypto, are positioning themselves for something most of the market hasn’t priced in yet.
Pulling It All Together
Here’s my framework for navigating the months ahead:
The risk-based approach. Rather than trying to perfectly time the bottom (nobody can), use a scaled DCA strategy. As risk levels drop lower, increase your position sizes. On the flip side, as risk levels climb, take profit incrementally. It’s systematic, it removes emotion, and it’s how professional allocators manage drawdowns.
The patience game. Bear markets are where wealth is built, but only for those who can stomach the boredom and the uncertainty. Expect counter-trend rallies that will tempt you to go all-in. Expect further dips that will tempt you to sell everything. The framework is your anchor.
The conviction bet. The convergence of AI and crypto is the secular trend I’m most excited about heading into the next cycle. Build your knowledge base now. Understand the protocols. Follow the builders. The next bull market will reward those who did their homework during the bear.
I’m building tools to make this kind of risk-based analysis easier to act on: tracking risk levels, automating DCA triggers, and monitoring on-chain signals in real time. If you want to be first to know when it’s ready, reply to this email and I’ll make sure you’re on the early access list.
See you next week.
Jake
Disclaimer: This newsletter is for educational and informational purposes only. It is not financial advice. Always do your own research and consider your own risk tolerance before making investment decisions.