

Crypto Super Hub — Weekly Market Intelligence | 30 May 2026
The phones went quiet this week.
Not silent. Quiet in that specific way I’ve learned to recognise from the desk. The people still calling aren’t panicking and they’re not chasing. They’re the ones with a ten-year plan who worked out a long time ago that the best entries feel terrible. Mostly SMSF money. Calm money. The kind that shows up when everyone else has left the room.
Meanwhile stocks are printing all-time highs and Bitcoin can’t catch a bid. BTC just lost the bull market support band and bounced straight off the 200-day on the way down. Risk-on everywhere else, and crypto still couldn’t hold the line. That tells you something the price alone doesn’t.
The CSH Score reads 29.6 today. Bottom 14% of every reading since 2011. We’ve been here before, and the people who understand what that means are already buying.
CSH Risk Dashboard
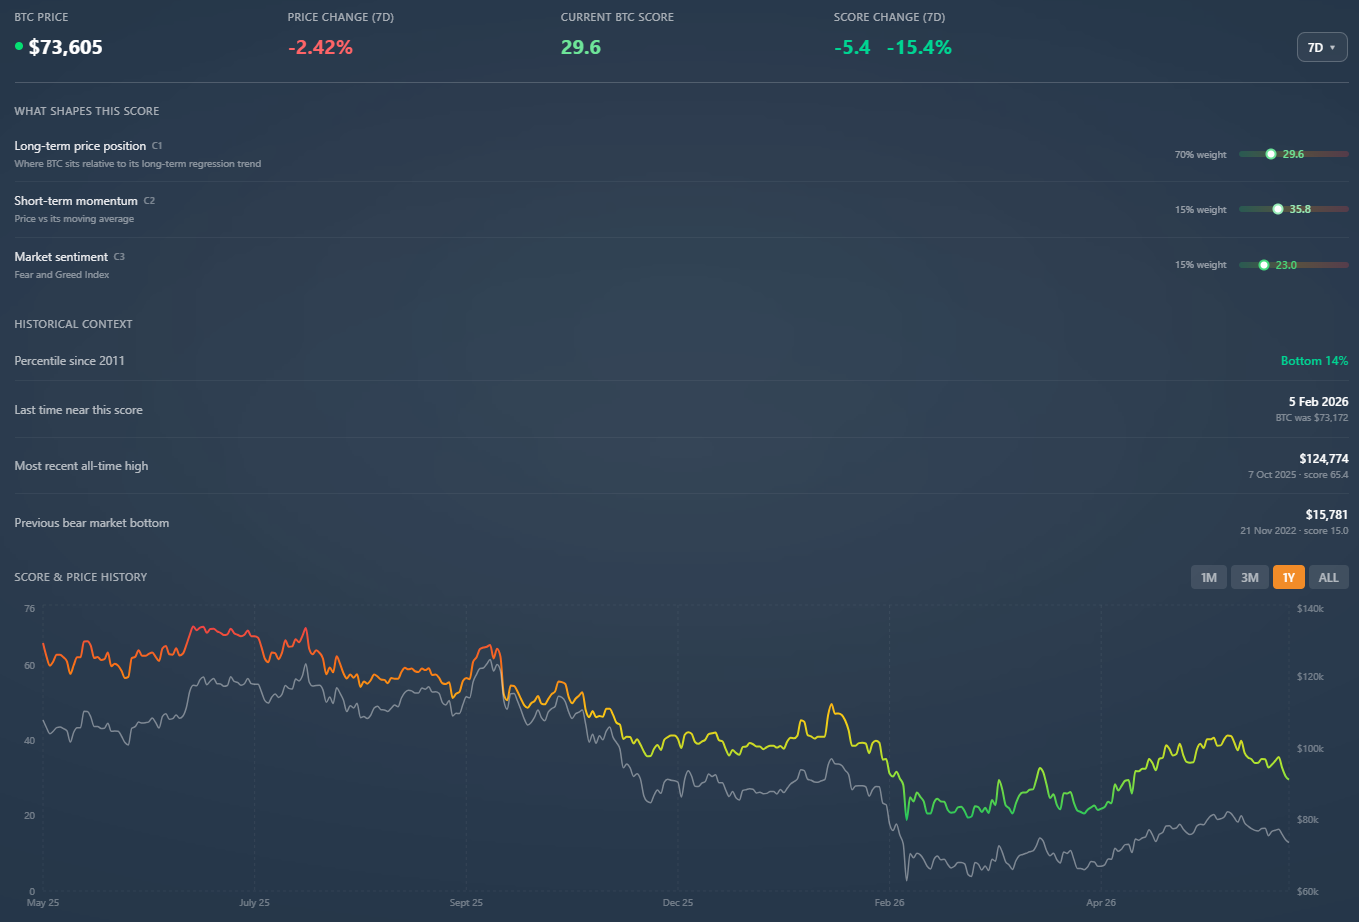
Score: 29.6 — down 5.4 over the week (-15.4%)
BTC: $73,749 Zone: Long-term accumulation
The breakdown: long-term price position 29.6 (70% weight), short-term momentum 35.8 (15%), market sentiment 23.0 (15%). Sentiment is the standout. Fear and Greed sitting at 23 tells you the crowd is scared, and scared is where the score earns its keep.
Some context that matters. The last time we were near this level was 5 February 2026, BTC at $73,172. The most recent all-time high was $124,774 on 7 October 2025 at a score of 65.4. The previous bear market bottom was $15,781 in November 2022 at a score of 15.0.
Read that last number again. The score can go lower. A reading under 20 has historically marked the entries people talk about for years, and I’d be surprised if we don’t see one before this is over. The plain version: we’re cheap, we’re not yet at “everyone has given up” cheap, and the distance between those two states is where the real opportunity lives.
Where Do We Actually Bottom?
Attention now shifts from the 200-day to the 200-week.
For most of the last two years the 200-day moving average was the line that mattered. We’ve now rejected off it hard, and it’s flipped from support to resistance. So the question every long-term holder is quietly asking is the right one: if this is the next leg down, where does it end?
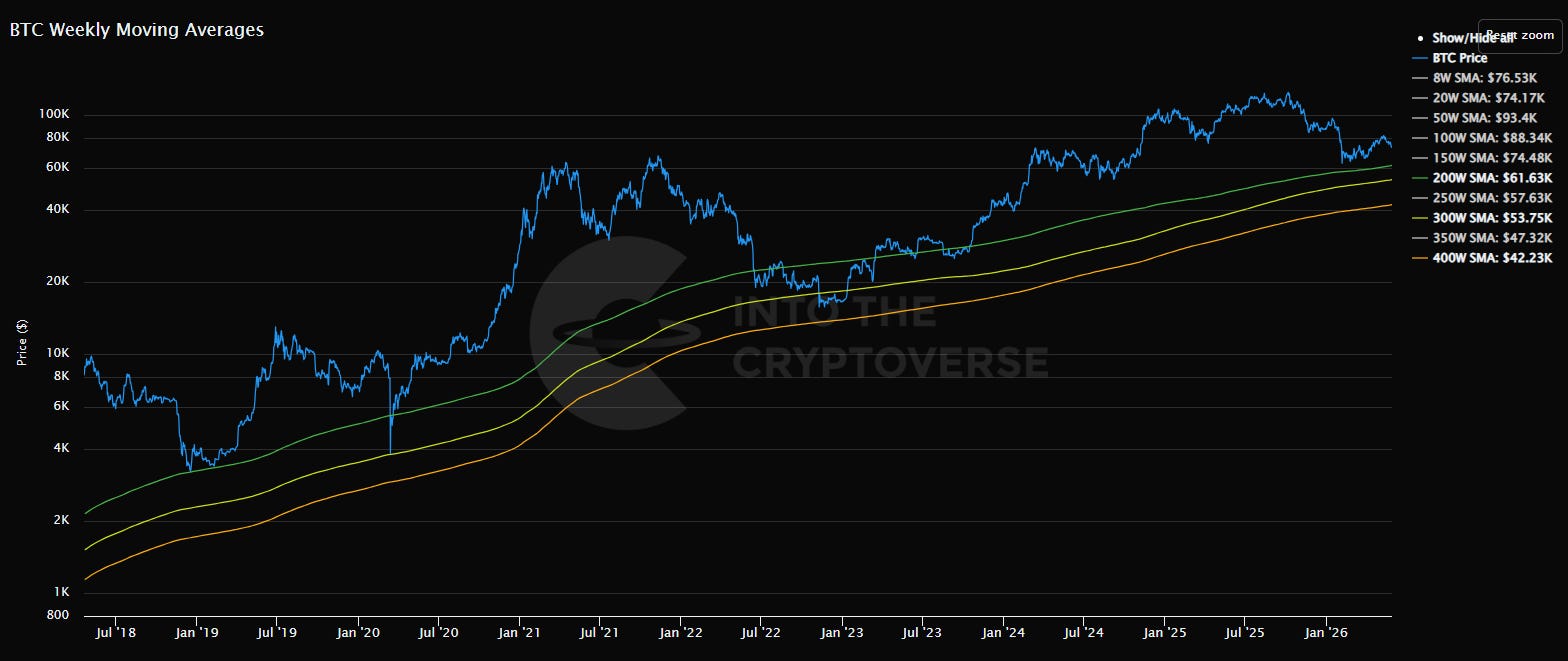
History gives us a map. In bear markets, Bitcoin tends to find its way back to the 200-week moving average. That sits around $61.6K right now. It’s the level that has caught price again and again across cycles, and it’s the first number I’d circle on the way down.
But “tends to” isn’t “always stops there.” In 2022 we didn’t just touch the 200-week, we sliced clean through it and kept going. Price went below the 300-week, which today sits near $53.7K. That’s worth sitting with. The deepest part of the last bear didn’t respect the level everyone was watching. It went lower, flushed everyone out, and then it bottomed.
So here’s how I’m holding it. A move to the 200-week around $61.6K would be a textbook bear market retest and a serious accumulation zone. A wash below it toward the 300-week near $53.7K would be 2022 all over again, and historically that’s the kind of move that marks a generational entry rather than a trap. Neither is a prediction. Both are levels I want my plan built around before we get there, not after.
And the timing lines up with the cycle. In the last two bear years, 2018 and 2022, June produced a lower low that wasn’t the final low. The final low came later, deeper into the year. The further into 2026 we get, the more weight I’d put on a big flush actually marking the bottom rather than just another leg.
This is the work. Not predicting the exact number. Knowing the levels, knowing what the score is likely to read at each one, and having decided in advance what you’ll do. The Plan Builder is built for exactly this kind of “if X, then Y” thinking, while you can still think clearly.
The Boring Money Is Buying
Here’s what most people miss about a market like this.
When the score dropped under 20 in early February and BTC touched $60K, that was a genuinely great entry. The score then climbed back to 40 by mid-May with BTC at $82K. Anyone who’d simply bought against the framework instead of their feelings would be sitting comfortably right now. No charts. No timing. Just a number telling them the odds had shifted.
That’s the whole point of a system. It doesn’t ask you to be brave. It asks you to be consistent.
We’ve just dropped back under 30 and into the accumulation zone. If you’ve been waiting for a signal, this is the kind of reading the framework was built for. And if we get the sub-20 print I’m expecting later in the year, the system will be flashing the same message it did in February. The only question is whether you’ll listen to it or to the noise.
The noise will be loud. It always is at the bottom.
Jake’s Workbench
Quick one this week, because I’m writing this before I head away.
The CSH Score has been live since February, and watching it work in real time has been the most satisfying part of this whole build. It called the February bottom. It called the May rally. It’s now telling us we’re back in accumulation. Three for three on the big moves, with not a single discretionary opinion from me.
That’s the difference between a tool and a take. A take needs you to trust the person. A tool just needs you to trust the data, and the data is checkable. That’s the entire reason CSH exists instead of being another signals group.
If you haven’t pulled your own reading yet, it’s free at cryptosuperhub.com.au.
Quick Hits
The CGT overhaul hit Parliament this week. Treasurer Chalmers introduced the tax reform bill to the House on 28 May, bundling four measures together: the CGT changes, new negative gearing limits, a $250 worker and sole trader offset, and a $1,000 instant deduction. Nothing was walked back from the Budget. The substance is as announced.
It’s now headed to a Senate inquiry. Within hours of the bill landing, a Senate inquiry into the CGT elements was announced, partly under pressure from the Coalition. So the path from here is: House, then the inquiry, then the Senate, with the government racing to pass it before the planned 1 July 2027 start. It is not law yet, and the inquiry could still shift the detail.
What’s actually proposed: the 50% CGT discount replaced with inflation indexation plus a minimum 30% tax on gains from 1 July 2027. It’s prospective. Gains accrued on existing assets before the start date keep the 50% discount. This squarely affects assets held personally.
Super sits outside these CGT changes. The reform targets individuals, trusts and partnerships. The super framework wasn’t part of the package, so the concessional treatment inside super is expected to continue. The gap between holding personally and holding in super has arguably never been wider. Separately, Division 296 (the extra tax on very large super balances) is already legislated and starts 1 July 2026.
BTC lost the bull market support band. Sharp rejection off the 200-day weekly MA, which is now acting as resistance. The structure that held through the whole 2023–2025 run has flipped.
The Week Ahead
Watch the 200-week at ~$61.6K. If we keep grinding down, that’s the first major level history points to. How price behaves there tells you a lot.
Watch for a sub-20 score. If selling accelerates, the framework will move fast. Have your accumulation plan written before that happens, not during.
June seasonality. In the last two bear years, June produced a lower low that wasn’t the final low. Worth holding in mind if we drift lower from here.
The Close
I’m away for the next week, so this one’s going out while I’m off the grid.
If the score drops while I’m gone, don’t wait for me to tell you. The whole point of building a system is that it works without anyone holding your hand. Pull your reading, check your plan, act on the number.
Create your free CSH account at cryptosuperhub.com.au and see where we sit.
See you on the other side. — Jake